Commentary:
1. Context of this report:
The Indian equity market correction seems to be close to be bottomming out. But, there is no guarantee that the bottom has happened. If there will be further corrections ahead, it is hoped to be within single digit percentage at main indices level. Also, it is not clear, how long one needs to wait before confirming the bottom.
Therefore, it is a good option now to take a new benchmark as to how the specific sub-types of equity funds have performed recently since the last report (As on Dec 13, 2024). This report per se is not going to be much useful other than putting the corrections since the last report into a perspective. However, this report will be useful as a comparative benchmark with the next report I will attempt soon after confirming the bottom of the market, which could be within the next 30 or 60 or 90 days ahead.
2. How to carefully read this report?
2.1. Familiarise yourself with the different sections of the summary report shown above, then you can find this report quite useful and easy to understand.
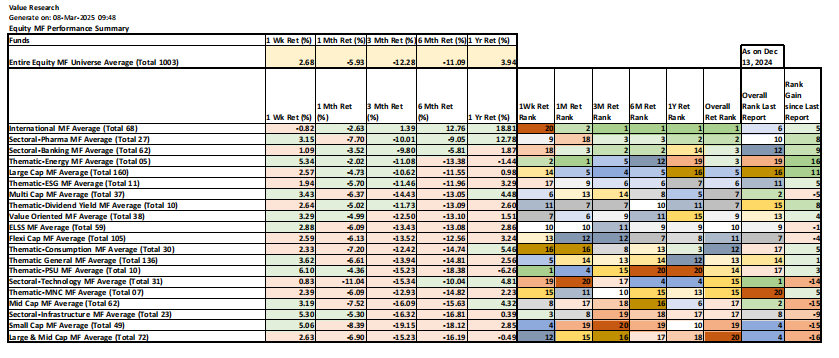
2.2. Top left portion is the overall equity mutual funds universe summary across approx. 1003 equity mutual funds, with return percentages for various timelines 1W, 1M, 3M, 6M, and 1Y. These returns will act as a benchmark for us to compare each mutual subtype returns by various timeline.
2.3. Below this top portion, you will see 20 mutual fund subtypes listed with indication as to how many equity mutual funds are there in each sub-type. These sub-types are listed in the order of overall performance ranking across all the timelines. Will explain soon as to how such a ranking is arrived. One can see the return averages of these sub-types, in the color green or red. The color green is assigned if the sub-type return for the specific timeline is equal to or higher than the average return of the entire equity mutual fund universe for the same timeline (marked in amber). The color is assigned red otherwise. So, it makes sense that the sub-types tend to have more red colored returns as we go down the list.
2.4. After the columns of the actual returns by timeline, the overall return rank of the sub-type is also computed by timeline to the right. These ranks, are marked to be 1 to 20, 1 being the highest rank. Each rank is marked with a specific rank, so that one can look for a specific rank within a timeline across all sub-types.
2.5. Then overall rank of the sub-type is assigned. This is computed by taking the average of all the ranks across all the timelines from 1W thru 1Y. The sub-types are then sorted with lowest average rank score at top. It is possible that two or more sub-types can have same rank, in which case all are assigned the same rank number. For example, Banking and Energy sub-types have the same rank of 3, therefore rank 4 is skipped, the next rank for the Large Cap is marked as 5, as the rank 4 had to be skipped due to repetition of rank 3.
2.6. Overall rank of each sub-type from the previous report as on Dec 13, 2025 is also noted next. With this, Ranking gain is computed, as the difference between the last report ranking and the ranking in this report. Positive ranking difference is good, negative ranking difference is bad for the specific sub-type this time.
The ranking difference is grouped in different colors as follows:
2.6.1. Positive rank upgrade beyond 10 ranks
Thematic - Energy
Large Cap
2.6.2. Positive rank upgrade between 6-10 ranks
Pharma
Banking
Dividend Yield
2.6.3. Positive rank upgrade up to 5 ranks
International
ESG
Value Oriented
Consumption
Thematic General
PSU
MNC
2.6.4. No ranking change at all
None this time
2.6.5. Ranking slippage up to 5 ranks
Multi-Cap
ELSS
Flexi Cap
2.6.6. Ranking slippage between 6-10 ranks
Infrastructure
2.6.7. Ranking slippage beyond 10 ranks
Technology
Mid Cap
Small Cap
Large & Mid Cap
3. Key inferences for investment decisions.
3.1. Personally I am not going to invest now, as I want further confirmation of bottomming out. However, it is difficult to confirm bottomming. Hence if you like to go ahead and invest, the following sub-types look attractive relatively due to better than the average returns in both the weekly and monthly timelines. Those sub-types are as follows:
Thematic Energy
Value Oriented
PSU
Infrastructure
Also, the following sub-types can additionally be considered for significant weekly gain recently. They are:
Small Cap
3.2. One should get into the detailed report of these sub-types and look for consistent performers marked in Green or Amber. The rules for Green and Amber are the same as in the weekly reports.
3.3. It is possible that there can be an exceptional performer shining bright in any sub-type though it is ranked lower. So, please browse across all 20 sub-types for such a winner, if any. For example: Within Thematic General sub-type, Motilal Oswal Manufacturing fund and HDFC Defence Fund have shown significant weekly gain though their performance across all timelines can not be confirmed to be a consistent leader. So, it is worth watching these two funds ahead as to whether they will continue to recover and become an investment candidate therefore.
4. Detailed reports by Sub-Type
Please note that when a sub-type has more than 50 funds, only the Top 50 funds are shown. Please note that all the funds are sorted based on 1M return.
4.1. International

4.2. Pharma

4.3. Banking

4.4. Energy

4.5. Large Cap

4.6. Thematic-ESG

4.7. Multi Cap

4.8. Thematic-Dividend Yield

4.9. Value Oriented

4.10. ELSS

4.11. Flexi Cap

4.12. Thematic-Consumption

4.13. Thematic General

4.14. Thematic-PSU

4.15. Technology

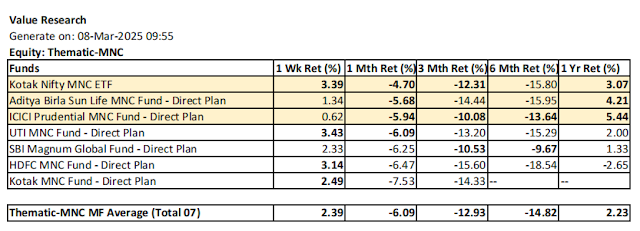
4.16. Thematic-MNC
4.17. Mid Cap

4.18. Infrastructure

4.19. Small Cap

4.20. Large & Mid Cap

Blog: NatsFunCorner! on Blogger
https://natsfuncorner.blogspot.com/
Other relevant Social Network Platform links:
Whatsapp Group: This whatsapp group is a peer group, people active in investment and trading (including day trading) are here, exchanging their insight and views. Please note that there is no room for promotional participation here.
https://chat.whatsapp.com/IuzkVAHgn1jJ20ZmB8m9Vz
FB: https://www.facebook.com/nupadhya/
YouTube: https://www.youtube.com/user/nupadhya
Instagram: https://www.instagram.com/natsupadhya/
Twitter (X): https://twitter.com/nupadhya
LinkedIn: https: https://www.linkedin.com/in/nupadhya/
Disclaimer:
- This is not a solicitation for mutual fund investment nor an advice. It is only an insight to help investment decisions based on the free MF performance data downloaded from Value Research. Investment decisions are only yours to make.
- Mutual fund investments are subjected to market risk. Read the propsectus of a mutual fund for all the risk information associated prior to investment.
- The author can not be responsible for the ommissions or errors in the data from Value Research or the data processing errors if any by the author.
- All your investment decisions need to be based on your decision finally, with no blame to anyone else later.
No comments:
Post a Comment