
Commentary:
Summary:
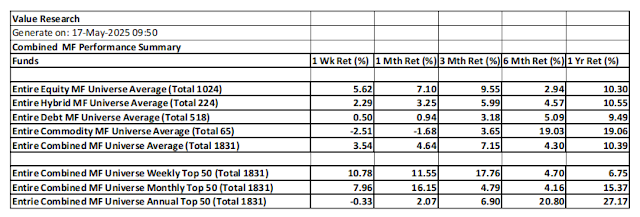
The equities and hybrids improved the performance thru this week, but debt and commodity funds lagged compared to last week.
1. Combined Funds Top 50
All the 1800+ funds from all fund types are tabulated to identify Top 50 ones for the week, month and year.
1.1. Combined Funds Top 50 Summary
Due to decisive victory of the Indian military in the recent squirmish with Pakistan, there is a sense of jubiliation in the country, and therefore the defence stocks are being bet on significantly thru this week, taking them to top performing status. But, by the next weekend, whether this positive sentiment will remain on the defence stocks is a huge question mark.
Due to equities super performance thru this week, the combined Weekly Top 50 and Monthly Top 50 reports are mimicking the same of equity funds. Though Commodity funds do appear on the Annual Top 50 in big numbers, they have lost the luster of green or amber color, meaning consistent performance promise.
1.2. Combined Top 50
Green and Amber color marked mutual funds in the list: Since the focus is not only looking for the performance leaders, but also consistent above average performance across all the timelines, the funds are marked in Green or Amber to easily recognize consistency of perfromance among the leaders.
Green:
If the returns for all the available timelines from 1W thru 1Y is above the average within the list. The fund can not be marked green even with this rule if the returns are not available beyond a month, in which case the fund is marked as amber only.
Amber:
If the returns for all the available timelines from 1W thru 1Y is above the average within the list except for one timeline. For this exception, if any of the weekly and monthly returns are above average, then both timelines are considered to have above average
1.2.1. Combined Weekly Top 50


Equities improved performance on Weekly average of Weekly Top 50 and Monthly average of Monthly Top 50, but not so on Annual Average of Annual Top 50.


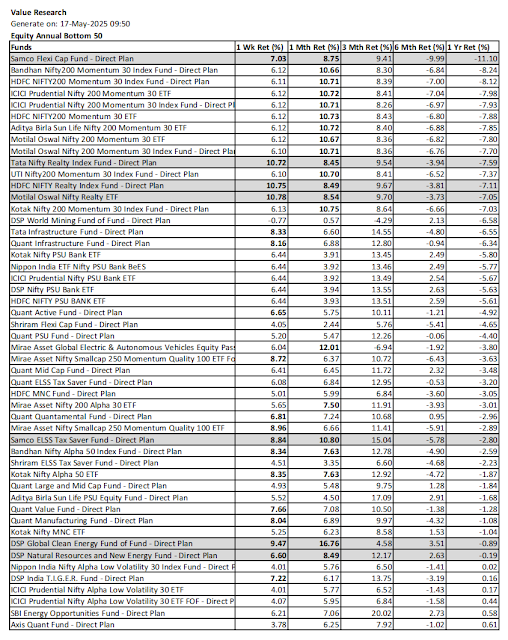
Both the weekly and monthly bottom 50 lists are leveraged to identify potential bearish reversal indications of the funds. This is done by marking above average annual return in bold and below average returns for the week and month. The funds with both weekly and monthy below average, but annual above average are marked in darker red, while the funds with only one of the weekly and monthly below averages but with above average annual return are marked in light red.
Annual bottom 50 funds list is used to recognize potential bullish reversal. Any fund with above average return for both the week and the month in the list is marked as grey indicating potential bullish reversal.


Blog: NatsFunCorner! on Blogger
https://natsfuncorner.blogspot.com/
Other relevant Social Network Platform links:
Whatsapp Group: This whatsapp group is a peer group, people active in investment and trading (including day trading) are here, exchanging their insight and views. Please note that there is no room for promotional participation here.
https://chat.whatsapp.com/IuzkVAHgn1jJ20ZmB8m9Vz
FB: https://www.facebook.com/nupadhya/
YouTube: https://www.youtube.com/user/nupadhya
Instagram: https://www.instagram.com/natsupadhya/
Twitter (X): https://twitter.com/nupadhya
LinkedIn: https: https://www.linkedin.com/in/nupadhya/
Disclaimer:
- This is not a solicitation for mutual fund investment nor an advice. It is only an insight to help investment decisions based on the free MF performance data downloaded from Value Research. Investment decisions are only yours to make.
- Mutual fund investments are subjected to market risk. Read the propsectus of a mutual fund for all the risk information associated prior to investment.
- The author can not be responsible for the ommissions or errors in the data from Value Research or the data processing errors if any by the author.
- All your investment decisions need to be based on your decision finally, with no blame to anyone else later.
No comments:
Post a Comment