Friday, March 22, 2024

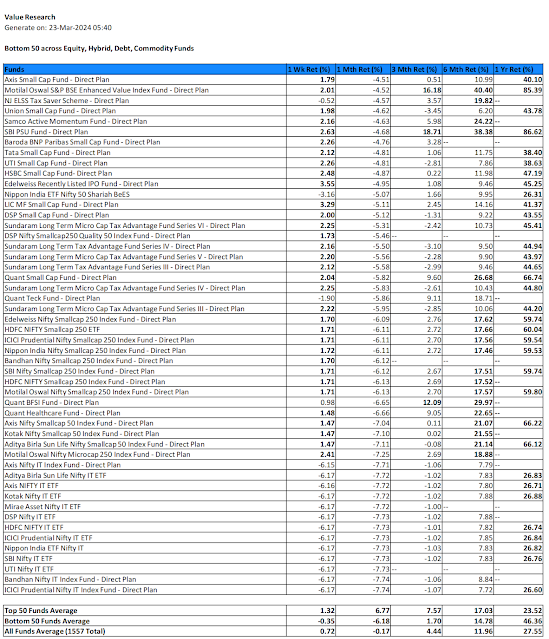
Top 50 and Bottom 50 Funds based on 1M performance as on March 23 2024


Commentary:

1. From this issue onwards, Top 50 is distinguished not only for the entire MF universe (aaprox 1500 plus), but also for each fund category i.e. equity, hybrid, debt and commodity. Comparisons of averages across various tables give further insight as to what is happening in the market fron the MF investments perspective.

2. Looking at Top 50 funds across all types, the average performance is ahead in all timelines except for the 1Y period. What this means is that the correction on equity funds has been effective enough to take the shine on performance till 6M timeline. But, when we compare the averages of bottom 50 funds against the funds universe average, bottom 50 funds still rule in 6M and 1Y category, because the bottom 50 are filled with the best performers of the earlier bull period.

3. Looking at the top 50, the investment worthiness which is to have higher returns than Top 50 average in all the timelines from 1M thru 1Y, the international equity investments make it to the criteria, and none of the domestic equity based funds.  Other than the international equity based funds, it is mostly the commodity funds who make it to the top 50.

4. Looking at the bottom 50, though these funds are laggards on 1M performance, many of them have shown nice recovery through the last 1W, but not enough to erase the losses thru the rest of the 1M. So, if recovery continues like the two sessions in this week, we may find some of these funds from the bottom 50 to spring out of bottom 50, if not to the Top 50.  We need to see, what kind of funds will make it to top 50 in such a case, will it be hybrid funds, flexicap funds, speciality funds etc.

5. Comparing the top 50 across debt and commodity funds, commodity funds are showing better performance in almost all timelines.

6. Among the hybrid funds, Top 50 are still underperformers against the rest of hybrid funds in the 3M, 6M and 1Y timelines. What this means is that the traditional leaders among hybrid funds have corrected recently more than the rest in the category, which means the multi asset aspect or the arbitrage aspect has not worked much wonder so far against the correction.

7. Bottom 50 is filled with most of the IT funds in addition to small cap and microcap funds.

8. Market behavior thru next week could give more clarity ahead, whether the equity and hybrid funds will continue to correct or not, vs. will there be recovery Vs. will the commodity funds remain attractive for short term.

9. Personally I have withdrawn 70% of my mutual fund investments through this week at the risk of short term capital gains tax and exit loads.  This is because, personally I like to protect my capital short term till the market bullishness around equity is reestablished, which could be within next 15-60 days, and then I will have funds to re-enter with vangience.  I am anticipating some recovery through the rest of the March, which could be given away again in April due to Fourth Quarter result disappointments. I could be wrong here, but one needs to take a stand at the risk of being wrong.  I also made fresh investments into Gold Funds, (SBI and Axis). 


Saturday, March 16, 2024

Top 50 and Bottom 50 mutual funds based on last 1M Return across all types of funds - As on March 16, 2024


Commentary:

1. Big take away this time is that market direction has confirmed reversal as to the bullishness of equity funds. The commodity funds are ruling the top 50, except for one speciality fund focused on Europe offshore.

2. Therefore, there is no need for me to do over-analysis to figure out the funds that have fallen from top 50 when compared to 28 days prior.  So the report looks simple.  

Instead I have introduced two more information

    - A separate bottom 50 funds report based on last one month return.
    - Average return of all mutual funds (Approx. 1559 this time) across timelines.

- May be I can give the average return of all mutual funds by mutual fund category, from next week. This is something I noticed now, it is too late to go back and do the further donkey work.

3. One can see that the 3M, 6M, and 1Y average of Top 50 funds is lower than that of entire MF universe across all types of funds. This is because majority of funds are either equity or hybrid, and they still have a sizable return in these timelines when compared to the commodity funds in the top 50, whose returns across these timelines will be slightly better than the fixed deposits.

4. Another key observation is that either the debt funds or the hybrid funds have not made into the top 50 list. This is because commodity funds are way ahead of them in 1M performance.  

5. As per the current trend, one can park excess money in top performing commodity funds, for returns superior than fixed deposits.

6. We do not know as to how long and how deep this bearishness will cast on equity funds. May be, equity funds will pop in top 50 after one or two weeks, or not.

7. We get one more chance of Top 50 and Bottom 50 report before this financial year ends for any liquidation of existing mutual fund investments for tax purposes. I am not making any recommendation as to such decisions as I may not be qualified for the same, and also it depends on one's investment strategy. For example, one committed to the Systemic Investment Plan will continue to make regular payments and get more units for those payments due to reduced NAV of such funds.

8. But I am very clear as to my investment approach. Looking at the bottom 50 funds report, the smallcap and microcap are way too underpeforming, and it is unlikely that they will see a reversal soon, and if there is any reversal, then we can see so in the weekly analysis ahead. Since I have next 15 days to liquidate some of my existing MF investments for FY 2024 tax adjustments, I am going to liquidate all pure play small cap and micro cap funds fully, because I will keep this money in the sideline to reenter when they start popping up in the top 50 performance again. Also, given the financial year end and no projection of quick revival of smallcap and microcap, many people like me going for liquidation can create a run on the bank condition on such funds, so we may find worse performance of these funds through next two weeks before things become better for them.  Again, this is not what I am asking you to do, as a disclaimer.

Friday, March 8, 2024

Top 50 Mutual Funds based on 1M Return as on March 8, 2024


Commentary:

1. Market is correcting on midcap and smallcap, certain large caps are taking the top benchmark indices to new level. So, we can expect major churn out in the top 50. Since the commodities like Gold and Silver are doing well, commodity funds have popped up into top 50, but they should be considered as a replacement for FD and not equity. Hybrid and debt funds dint make it to top 50 funds list yet.

2. The weekly list of top 50 funds is useful for the fresh investments. Since, the average of top 50 funds across different timelines is given at the bottom, one should consider consistent performance across all timelines, which is basically having the return higher than top 50 averages across all the timelines. Such funds are bolded this time. 

They are as follows:

- DSP Nifty PSU Bank ETF

- HDFC Nifty PSU Bank ETF

- ICICI Prudential Nifty PSU Bank ETF

- Kotak Nifty PSU Bank ETF

- Nippon India ETF Nifty PSU Bank BeES

- CPSE ETF.

3. If one wants to compromise on below average of top 50 returns on 1w or 1M levels, a dozen more funds look reasonable, even in the list of funds going out of top 50. For example, Quant Large & Midcap Fund came short on 1M return, but has good 1W return, so it may be a candidate to consider, else, if large cap rally continues, it might make it to top 50 next week.

4. Since Gold and Silver are in the up move, one can start considering such funds as a replacement for FD. In such case, I find Axis Gold ETF having better returns across all timelines, beating FD returns.

5. As guessed last week, Quant Fund family is getting impacted with the latest market dynamics in the sense that not a single fund made it to top 50 this time. 

6. The various averages at the end are very useful to summarise the market action, across lat 1 week, and last 28 days.  As one can see that average returns are fading across all timelines, when compared to last week.

7. With market dynamics being very volatile now a days, this weekly report based on top 1M return is becoming more and more useful for fresh investment considerations and to readjust Mutual fund return expectations based on new market dynamics.

8. I am bit disappointed that certain hybrid funds could not make to the top 50 list. This is becasue, the aggressive equity portion in such funds were impacted by the midcap and smallcap corrections, so much so that other thematic funds did better to come into top 50.

9. As the market dynamics change, new funds are being launched with new themes. Some of such funds keep popping up in top 50, but with no 6M and 1Y track record. One can take risk on such funds too. For example, ICICI Prudential Nifty PSU Bank ETF does not have a track record beyond 6M returns, but all the returns upto 6M timeline are good, so can be considered, hence, I have already included in my list of investment elegibilities by making the fund name bold.

10. Remember, for your monthly investments, you get to see this kind of weekly report four times, so you can stagger your monthly fresh investments across four weekly reports.  Last week, Quant Infrastructure Fund made it to the eligibility by having above average returns in all the timelines, but it has fallen from the top 50 this week, with below average returns both on 1M and 1W timelines, but it does not mean that investment made last week was a mistake. It might return to top 50 in weeks ahead or it might not. So, focus every week is about new investment focus, and not to second guess on prior investments. 

11. For myself, the performance target benchmark is half of the top fund return for 1Y. In this report it is CPSE ETF which has given 106%, half of which is 53%. But the top 50 average 1Y return this week is 49.55, which means that there is a risk of not achieving my previously set benchmark, if the market volatility continues. In such case, I will settle for 70% of top 50 average = 70%.49.55 = 35% for now.  Please note that the benchmarks will keep changing as market dynamics shape up week to week.


Friday, March 1, 2024

Top 50 Indian Mutual Funds based on 1M Return as on March 1, 2024


Commentary:

1. How this table is useful? 

By focusing on the top 50 funds based on last 1M return, it is possible to identify consistent performers across all the timelines till 1Y, which are more suitable for fresh investments, as they are keeping up with the market dynamics.

The funds that were in top 50 as on 28 days back, but not any more are marked in Red at the end. In this, one would still see consistent performers, but with 1M Return lower than the top 50 through this period. It is possible that some of these will return to Top 50 again ahead.

The concept here is that, by sticking to consistent performers across all the timelines from 1W thru 1Y for fresh investments, it is possible that our investment returns in the portfolio will be better than average, as we will be doing far more justice against the trap of "past performance is not an indication of future performance".  By ensuring consistent performance across all timelines till 1Y, we will minimize falling into the trap of one time darlings, who otherwise underperform after initial shining.  For example, the very first row in this report, Mirae Asset Hang Seng TECH ETF is a way underperformer for 3M, 6M, 1Y timelines, hence wont make it to our investment decisions in spite of greater performance thru 1M and 1W time periods.

Since this report is produced on a weekly basis, one gets four chances to hang on to the consistent performers, so a good fund missing for a week, can re appear ahead, and be considered again for fresh investments.

So the game here is to improve the portfolio level return at least to the 50% of the return of top performing fund. In this report, top 1Y performing fund has given 106%, so our self esteem needs to be tuned to expect 53% return thru market dynamics ahead, which can not be guaranteed, but the portfolio management attention will improve. Beyond this report, one needs to make Hold and Sell decisions, again these dynamic benchmarks will help there too. 

For example, if the 1Y benchmark is 53%, I may still hold on to a fund which has given only 25% through the year, but may sell of a fund which has only 15% return, even at the risk of additional 5% taxation, as I may be confident to achieve more than 20% return with the freed up money thru fresh investments ahead based on anticipated market dynamics. 

So, when it comes to the portfolio management, the benchmarks for Sell decisions need to have far more tolerance, and need to account for potential corrections and taxation, and ability of the underperforming fund to withstand such corrections too.

At the portfolio management level, Hold decisions are the easiest, as one needs to do nothing.

But, one significant change here is that we hope to cling on to the top performers among consistent performers, and hence increase our portfolio returns than passive SIP investments to a fund which had a past glory and has not done well recently.  The counter to this could be that a Momentum based buy decision could lead to significant correction ahead, but by ensuring consistent performance across multiple timelines, we minimize this risk.

2. Key further refinements through this week report:

 - Since market has become volatile, though the focus is 1M return, 1W return column is reintroduced, in order to assess whether the past glory of performance is already waning through last 1W, or the new heroes are emerging in the 1M list based on the potential last 1W flash in the pan peformance.

- Since the market is volatile, the arrogance of looking at only the equity and hybrid funds is now mended to include all types of funds. What this means is that if the debt and commodity funds are in a position to beat equity and hybrid funds in 1M performance, they will pop up in the list going forward.

- The top 50 average returns for various timelines for this period reporting will serve as the minimum benchmark, instead of my own heuristic judgemental benchamaks. These averages are shown at the end. This way, I do not have the burden to tweak my own judgemental benchmarks as the market dynamics change ahead.

-The top 50 average returns for various timelines 28 days back are also shown. This way, we can appreciate how these benchmarks are changing to higher or lower based on market dynamics.

- The two averages that are marked in grey at the end, are the 1M return averages 28 days back, first one is 28 days back to March 1, and second one is 28 days back to Feb 3.

3. Since market is being volatile and may lead to significant correction ahead through March, for fresh investments, I have decided to make the criteria bit more stringent, which is that the returns in all timelines including the 1W window need to be higher than or equal to the top 50 average.  Such returns are marked in Bold. As per this criteria, this week, I would consider only the Quant Infrastructure Fund for fresh investments.

Further observations:

4. This analysis is based on Value Research dat download. It has become clear that Value Research data can be erroneous, maily due to omission of certain funds. For example, the funds with no 1M return as on 28 days back are the ones missing in the report then. Similarly, the some of the funds falling off the top 50 are missing this time in the Value Research data, hence are not being shown here.

5. Though March 2 Saturday is a trading day, decision is to include that data as part of the next week report. This is different treatment than last time around, where the Saturday data was included for the same week. Decision to keep the weekly boundaries to Friday going forward.

6. You may notice that the 6M and 1Y average of top 50 funds as on 28 days back were way lower than the ones in this period. 14.23 Vs 33.45 for 6M, 28.89 Vs. 59.19 for 1Y. What this means is that in the report 28 days back, too many funds with lower returns for 6M and 1Y popped into Top 50, and better consistent performers through 6M and 1Y period have returned thru this report. One may notice that though there has been a considerable correction through this week, the averages of top 50 for different timelines are still healthy.  So, we can now observe how the market dynamics alter our own consistent performance benchmarks for investment decisions.  This is a good point to be included in the report such that on corrections, we may get negative returns as average, and we can assess the departure of these averages from the ideal averages when the market was hot in the past. 

7. You may also notice that Quant family has fallen from the grace of having highest number of funds in the Top 50. It is ICICI Prudential this time with 6, followed by Mirae and Nippon with 5 each. Quant has only 4. What this may indicate is that Quant funds may be underpeformers when the market turns corrective. Need further validation though.    

Saturday, February 24, 2024

Debt & Commodity Funds Returns Analysis across different short and long term time lines


 Commentary:

1. Debt funds are meant to give returns slightly higher than the Fixed Deposits. Debt funds can have higher risk than fixed deposits, and tend to give superior returns when the interest rates are falling. Debt funds return are primarily depending on interest of debt instruments, but the face value of a debt instrument can fall when interest rates are going up. Therefore, it is possible that a debt fund can also give a negative return through such periods.

2. Debt funds had a taxation advantage till March 2023, as indexation benefit was available. With that removed, the taxation benefits are gone, debt fund incomes are taxed at par with Fixed Deposits, as part of income.

3. For this analysis, both the debt funds and commodity funds are included, which are not included for the equity funds analysis.

4. Since, there is an expectation that prime interest rates are likely to fall from June 2024, there will be some interest in debt funds in coming months, to beat the returns of fixed deposits. So, some money may flow from fixed deposits to debt funds. Hence this analysis as a baseline before the debt fund attractiveness goes up in couple of months ahead.

5. For an equity investor, there is an opportunity to ride on debt instruments through hybrid funds. These hybrid funds can be aggressive on equity, conservative on equity, or can use balanced or of multi-asset approach. Hybrid funds are always included in my equity funds analysis. I would believe that only when the hybrid funds start beating the performance of pure equity funds, it is time for us to wake up to the reality of debt funds to leverage. When there is a correction in equity market causing negative return on mutual funds, the hybrid funds and debt funds will start looking attractive.

6. Therefore, with the tax savings advantage gone, one could say that debt funds can be considered to replace FDs when they become more attractive than FDs, and hybrid funds to replace pure equity mutual funds when the market starts correcting leading to negative returns on pure equity mutual funds.

7. There is inherent risk in debt instruments, and this risk is reflected through the credit rating of the instrument. But, this risk is managed overall at the mutual fund level. Therefore, it is always better to choose a debt mutual fund than a singular debt instrument like NCD etc. to manage the risk better.

8. Credit Risk Fund are a type of debt fund, where the focus is to invest on high risk debt instruments, leading to better returns as the interest rate associated are very high. Here, the strategy is to manage the high risk across the portfolio level, and ensure better returns than the usual debt funds. Typically, this works well when the economy and market are upwards, but when shit hits the fan, such funds can give massive negative returns. Since India market has been doing well since last three years, one particular credit risk fund has given more than 40% annualized return on a 3 year basis, which is amazing, but still pales against equity fund returns, given the level of risks are similar.

9. Personally, I have ensured my life style through FDs, and enjoying an average of 8% interest rate on them, hence I have ignored the debt funds so far, focusing purely on equity funds for MF investments. But, imagine that FD interest rates could be falling to 6% in future, and the debt funds giving superior 10% return, even I will be jumping into debt funds mode.

10. When it comes to the risk of pure equity funds risks, where the fund returns become negative on huge market corrections, my strategy is to shift to hybrid funds for fresh investments, as they will be popping on the top of the table in my weekly mutual funds analysis. I did this debt fund analysis for one time now, for me to get a grip of historic realities and a baseline benchamark before interest rates start falling in coming months.

11. Fair to say, that keep reading my weekly mutual fund analysis report, as it gives a good mirror to equity market dynamics, and your fresh investments are automatically adjusted to the new market realities, whether up or down.

12. Will consider a monthly debt & commodity funds analysis as they become attractive for fresh investments. If Gold invest becomes attractive, it will pop up in this monthly report as commodity funds to are included.

---------------------------

Top returns of Debt and Commodity Funds, both short term and long term

A. Short Term 

Section1 - 1 Week Return


Section 2 - 1M Return


Section 3: 3M Return


Section 4: 6M Return

Section 5: 1Y Retrun


Part II - Long Term Returns

Section 6: 3Y Return

Section 7: 5Y Return

Section 8: 10Y Return

Section 9: 15Y and 20Y Return


Mutual Fund Returns Analysis across different short and long term time lines - Useful to enhance our perspectives on mutual fund investments both short and long term!


Commentary:

This is an attempt to view top performing mutual funds based on different time lines.  All the data is from Value Research, and only the equity and hybrid funds are considered here.

Value research gives mutual fund data in two perspectives, short term and long term. It does not give the perspectives with both the short terms and long terms together. For value research, short term is presented in terms of 1W, 1M, 3M, 6M and 1Y. Long term is represented in terms of 3Y, 5Y, 10Y, 15Y and 20Y.

Ideally, I could have merged all timelines into different columns in one sheet, but that required combining two sheets using VLOOKUP. Since I use free office software and it does not give me that function, I have done this presentation this way, for my convenience.

If you have patience to combine the short term and long term perspectives into one single sheet, you can download the data from Value Research from these links, while downloading you need to select all Equity Funds once, and all Hybrid funds next, so you need to combine two worksheets once in each of Short Term and Long Term category, and then you need to integrate the two resulting worksheets at column level using VLOOKUP function.

Data source:

https://www.valueresearchonline.com/funds/selector/primary-category/1/equity/?plan-type=direct&tab=returns-short-term

Here, one needs to switch between Short Term and Long Term buttons given at the row where download to Excel option is given, and make separate excel down loads across two timelines.

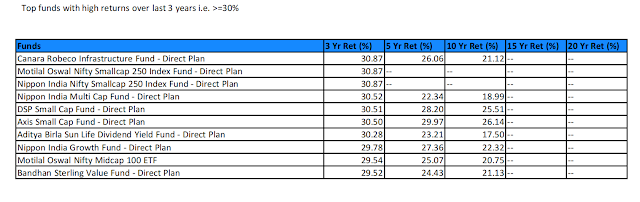
The mutual fund returns have become far more attractive in India since the last three years. Therefore, we can see funds with 3Y return as high as 52.58%. As we move the time window farther, the return percentage reduces, for two reasons. One is that both the market and the funds were not evolved like now a days. Second is that mutual fund performances tend to saturate over time like the index returns. Typically, index based mutual funds tend to follow the index level returns with 1 to 2% overhead due to expense ratio.  Also, we can see that as the time line is stretched far before, number of available mutual funds also dwindle. Also, here, we do not know the history of Indian mutual funds beyond Value Research boot strap, still we have 20 years performance data in this report.

Those who have been in the market for more than two decades are very much accustomed to 15-20% long term returns as healthy for mutual funds. Folks like me who are new to the fund investments, are very much spoiled by the recent top returns of mutual funds, and demand very high annual returns for the current market conditions.  While the old tigers are conditioned not to aim for more than 15 - 20% annual returns, we the new bees are aiming for 60% annual returns while such previlege lasts at least.

Here, I have used the following cut off benchmarks for the top performing funds by timeline:

    1W : >= 2.5% return

    1M : >= 10% return

    3M : >= 20% return

    6M : >= 35% return

    1Y : >= 60% return

    3Y : >= 30% return

    5Y: >= 25% return

    10Y: >= 20% return

    15Y : No benchmark, very few in the list

    20Y : No benchmark, very few in the list

Take a ride with different timelines, and give a bow to the top performers for each timeline. Also, note down the long standing high performers of yester years, and how the mutual fund market has expanded significantly through the last one decade.  The competition for top rankings will only go up further from here.

To put things in further perspective, I have quickly calculated nifty returns for the similar timelines by fetching approximate nifty levels from the charts over different timelines as follows:


Based on these levels, I have calculated nifty returns, and compared with highest return from a top fund for the same timeline, and a typical MF return at portfolio level at half of top fund return. Take a look:


My analysis on this:

1. Top performing mutual fund is way ahead of nifty returns for short term, but it starts falling closer to nifty returns for longer timelines. I have ignored 15Y and 20Y timelines for mutual funds as the mutual fund market then was not mature. 

2. What is an useful practical benchmark for our portfolio returns is in the last column, which is half of top performing fund return. This is some what close to the intuitive  benchmarks I have used for marking top funds in the report below. 

3. One insight going forward is that Indian stock market and therefore mutual fund market have been maturing considerably through last few years. Also, there is a good chance that the long term returns from India could be far better than they were 10 years before. Therefore, there is a need for the investors to adjust the self esteem and expectations higher into the future, and upgrade the expectations beyond the historic benchmarks, and set it somewhere in between what they were and whatever sizzling level resulted through the last three years.

4. Bottom line, through this analysis, I am further convinced that it is not crazy to aim typical 45% annual return from our mutual fund portfolio as per the current market dynamics. We need to adjust this expectation level if the dynamics cools off ahead.  Rest is the discipline of execution and portfolio management.

Browse the rest of the blog, and take whaever insight or inspiration you like to take with you for further steps.

Best wishes

Nataraja Upadhya


----------------------------------------------------------

Part A: Short Term - 1Y, 6M, 3M, 1M, 1W

Section 1: Top Funds based on higher return over 1 Year; Return >= 60%


Section 2: Top funds based on top return over last six months; Return >= 35%


Section 3: Top funds based on top return over last three months; Return >= 20%


Section 4: Top funds based on top return over last one month Return >= 10%


Section 5: Top Funds based on high 1 Week return i.e. >=2.5%


Part II: Long Term

Section 6: Top funds based on top return over last 3 years; Return >= 30%


Section 7: Top funds based on top return over last 5 years; Return >= 25%


Section 8: Top funds based on top return over last 10 years; Return >= 20%


Section 9: Top funds based on top return over last 15 years; 


Section 10: Top funds based on top return over last 20 years; 


Friday, February 23, 2024

Top 50 funds based on last one month return as on Feb 24 2024


Commentary:

1. The average 1M return of top 50 funds is 13.58%, which was 11.65% last week, which means that top 50 funds doing better than last one week.

The average 1M return of the same top fifty funds 28 days back were 6.08%, which means these funds accumulated accelerating gains thru last 28 days.

The average 1M return of top 50 funds as on Jan 27, which is 28 days back was 7.7%, again, confirming that riding on top 50 funds does give glimpse of better performers based on last one month return for the current market conditions. If the top 50 funds average based on 1M returns is an index like Nifty 50, the mutual funds at this index level are still doing great, the bull run is still on, though there is a churn out in the top 50 list.

2. When it comes to new investment decisions, it is recommended that one looks for consistent top performance across different time lines from 1M through 1Y, the top performers are highlighted in bold, based on the following benchmark which is 1Y Return >= 60%, 6M Return >=35%, 3M Return >=20%, and 1M Return in Top 50.

3. This list should be used mainly for buying new investments, not for hold and sell decisions. 

4. The rows in red are the funds which were in top 50 28 days back, but have fallen off the top 50 list as on this week. Here too, one may see consistent performers except for the 1M return. One needs to weight whether the 1M return for these will improve, or further erode through coming weeks, so definitely these funds deserve Hold, if not fresh Buy. Even Fresh Buy can be considered if there is faith that they will make it to top 50 again ahead based on anticipated market dynamics ahead.

5. Theory here is that, by focusing on top 50 funds with consistent top returns for all time lines upto 1Y, one gets to ride on the most recent bull trend of the funds, which will help to enhance the investment returns for the fresh investments as the trend tends to continue till it stops. So, if the benchmark here for top 1Y return is 60%, and one is happy with 30% annual return for MF investments in general for the current market dynamics, this approach for fresh investments may enhance the portfolio level return from 30% to 45% very likely.

6. Whem it comes to Sell decisions on low performing funds, the performance benchmarks used here are useful for evaluation. Further one needs to take judgement call as to whether hold a fund beyond 1 Year to save capital gain and Exit load overheads. (One will pay short term gain of 15% for holding for less than one year, and pay long term gain of 10% only for holding more than one year. This 5% difference and the exit load burden of upto 2% is a consideration for selling under performing funds before one year completion.)

7. One can see some trends in the top fifty as follows:

- PSU Bank Funds have come back in to vougue. PSU Funds are still attractive.

- One large cap fund has made it back to top 50, and it is from the Quant family. Bravo! But, it is still an under performer against 6M and 1Y performance benchmarks.

- Certain pharma, healthcare, power and infra funds have fallen from top 50.

- Quant family has improved its hegemony in top 50 funds list thru this week, there are 12 among top 50. Of course, there is a churn out as to which are these 12 funds.

- The second top fund house here is ICICI Prudential, 6 funds in top 50.

8. CPSE ETF regains top spot for 1Y return, which 110% and triggering tears, tears of joy for those riding on it, and tears of lost opportunity for those missing on it. Interestingly, this is a quirk of Value Research, as this is more of an ETF than a mutual fund, if you want to invest in it. So, you will need a demat account to pursue this ETF.

110% annual return is the bearer of the flag for India continuing to shine in the markets, even through the MF path.

Mera Bhaarath Mahaan!

 9. Again I challenge positional traders to beat the 1Y return benchmark of 60%, and the short term traders to beat the annual return benchmark of 100%, if there is underperformance in your portfolio against these benchmarks, please consider yielding to mutual funds path to save you agony and time!

10. Standard disclaimers apply. Past pefromance is no guarantee for the performance ahead. But, in mutual funds arena, consistent performance across various timelines is a good bet to have.


Best regards,

Nataraja Upadhya