Sunday, December 15, 2024

Special Mutual Fund Report: Detailed Short Term Return Analysis of Equity Funds by Sub-Type as on Dec 13, 2024


Commentary:

1. On Dec 13th market session, the Indian equities first corrected significantly, but recovered from that correction, and rallyed further, thus sending a strong bullish signal, both on indices and broader market segment. So, this bullish reversal signal can be leveraged as an ideal time to make post correction significant investment in the Indian equity mutual funds space, for which this report helps further in addition to the Top 50 mutual funds report already released for this weekend.

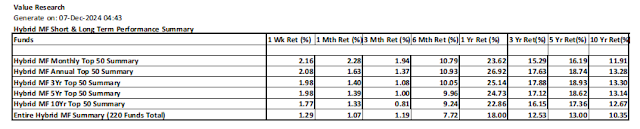
2. The top left portion of the table above gives the average equity fund returns across all equity funds for different timelines from 1W thru 1Y which is used as a bench mark to compare the returns of individual sub types across each timeline.

3. The left bottom portion lists the 20 sub types and their average returns for all the timelines. The returns if above the benchmark return, then it is marked in green, else red.

4. There are only two sub types which have shown above the average returns in all timelines i.e. 1W thru 1Y, and they are Technology funds and  Multi Cap funds.

5. Then, there are some fund types that have given above average return in all timelines except for one.

    5.1. Mid cap funds, above average returns in all timelines except for 3M timeline.

    5.2. Small cap funds, above average returns in all timelines except for 1W timeline.

    5.3. Large & Mid cap funds, above average returns in all timelines except for 3M timeline.

6. The following funds types have been giving above average return for both the 1W and 1M timeline, meaning favorites for ultra-short term:

    Technology

    Mid Cap

    Multi Cap

    Large & Mid Cap

    ELSS

Therefore it is fair to say that this analysis will help to find many consistently performing leading funds for further investment.

7. My personal favorites from this report and the previous weekly Top 50 report for further investment in equity funds due to consistency of superior performance short term (1W thru 1Y) are as follows:

    Motilal Oswal Nasdaq 100 FOF

    Motilal Oswal Multi Cap Fund

    Motilal Oswal Business Cycle Fund

    Mirae Asset NYSE FANG+ ETF FOF

    Motilal Oswal Mid Cap Fund

    HSBC Mid Cap Fund

    Tata Nifty Capital Markets Index Fund

    Motilal Oswal Manufacturing Fund

    Motilal Oswal Flexi Cap Fund

    Motilal Oswal Small Cap Fund

    Motilal Oswal Large & Mid Cap Fund

    WhiteOak Capital Digital Bharat Fund 

    Invesco India Technology Fund

    LIC MF Infrastructure Fund

    Motilal Oswal ELSS Fund

    White Oak Capital Special Opportunities Fund

As one can see, this list is too long meaning one may not be able to invest in all these together, so there is enough choice to make when we pursue consistent perform leaders as the basis for investment, and that is good news.

One can also make Hold and Sell decisions on their portfolio based on the overall performance across all timelines on one's holdings. For example, the Consumption funds lost their shining, and now with the promise of bulls return the Pharma funds are losing shine. I personally churn 20-30% of my holdings to release new cash for more bullish opportunities ahead, it is just my style of investment. (But, my overall equity & equity MF portfolio size is growing from correction to correction).

8. Please note that the returns in certain timelines can be green even with negative return if the benchmark returns too are negative, which is primarily for 3M timeline.

9. The sub types are listed as per their overall return rankings. Overall return rankings are computed by assigning individual ranking for each return by timeline, and then average ranking is computed across the five timelines. The sub-types are sorted per the best to worst overall rankings.

10. The current overall ranking is compared with that from the previous report, which was as on Nov 15, 2024. 

The following ranking changes since the last report can be observed:

11.1. Significant ranking improvements: Improvement by more than 5 rankings:

    Mid Cap funds

    Small Cap funds

    Infrastructure funds

  11.2. Reasonable ranking improvements: Improvement by within 5 rankings:

    Multi Cap funds

    Large & Mid Cap funds

    Thematic (General) funds

    Thematic PSU funds

    Thematic Energy funds

  11.3. No ranking improvement or degradation:

    Technology funds

    ELSS funds

    Banking funds

  11.4. Reasonable ranking degradation: Degradation by upto 5 rankings

    International funds

    Flexi Cap funds

    Dividend Yield funds

    Large Cap funds

    Consumption funds

    MNC funds

  11.5. Significanr ranking degradation: Degradation by more than 5 rankings

      Pharma funds

      ESG funds

      Value Oriented funds 

12. Detailed returns analysis by fund sub type

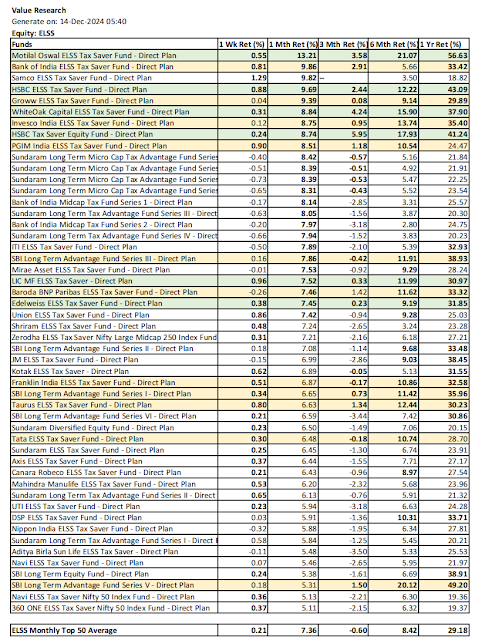
12.1. Each fund sub type is listed with funds in descending order of monthly return. Only the top 50 funds are shown if the funds in a sub type are more than 50.

12.2. The consistency of returns of funds are marked in green or amber color as follows:

    - Funds with above average return in all timelines within the list are marked in green. Please note that the funds in green too can have negative returns in certain timelines as the average return in that timeline itself is negative.

    - Funds with above average retuen in all timelines within the list except for one timeline are marked in amber. For the amber rule, if anyone across 1W and 1M return is above average, then both are considered as above average. If both the 1W and 1M return are below average, they together are counted as below par within one timeline.

    - Funds with no return info beyond 1 month can not be green, but only amber - this is to avoid giving green status for spurious ultra short time spikes

12.3. The detailed returns by sub-type by their overall ranking:

12.3.1. Technology Funds


12.3.2. Mid Cap funds


12.3.3. Multi Cap funds


12.3.4. Small Cap funds


12.3.5. Large & Mid Cap funds


12.3.6. International funds


12.3.7. Flexi Cap funds


12.3.8. Infrastructure funds


12.3.9. ELSS funds


12.3.10. Pharma funds


12.3.11. ESG funds


12.3.12. Banking funds


12.3.13. Value Oriented funds


12.3.14. Thematic (General) funds


12.3.15. Dividend Yield funds


12.3.16. Large Cap funds


12.3.17. PSU funds


12.3.18. Consumption funds


12.3.19. Energy funds


12.3.20. MNC funds


13. Whether it is a weekly Top 50 MF report or special MF report, these are availble in the blog indicated below. Blogs are also rendered as videos (on Youtube and Instagram) for those not prefering to read.

Blog: NatsFunCorner! on Blogger

https://natsfuncorner.blogspot.com/

Other relevant Social Network Platform links:

Whatsapp Group: This whatsapp group is a peer group, people active in investment and trading (including day trading) are here, exchanging their insight and views. Please note that there is no room for promotional participation here. 

https://chat.whatsapp.com/IuzkVAHgn1jJ20ZmB8m9Vz

FB: https://www.facebook.com/nupadhya/

YouTube: https://www.youtube.com/user/nupadhya

Instagram: https://www.instagram.com/natsupadhya/

Twitter (X): https://twitter.com/nupadhya

LinkedIn: https: https://www.linkedin.com/in/nupadhya/


Disclaimer:

- This is not a solicitation for mutual fund investment nor an advice. It is only an insight to help investment decisions based on the free MF performance data downloaded from Value Research. Investment decisions are only yours to make.

- Mutual fund investments are subjected to market risk. Read the propsectus of a mutual fund for all the risk information associated prior to investment.

- The author can not be responsible for the ommissions or errors in the data from Value Research or the data processing errors if any by the author.

- All your investment decisions need to be based on your decision finally, with no blame to anyone else later.

Friday, December 13, 2024

Top 50 Mutual Funds Report as on Dec 13, 2024


Commentary:

1. Equity Mutual Funds

1.1. Equity Mutual Funds Performance Summary

The equities did progress for the week, but not as much the previous week. The annual average return of all equity funds fell below 30% thru this week. The three months average of equity funds fell below again. The weekly gain of Weekly Top 50 is not as much the previous week, but the Monthly Gain of Monthly Top 50 is quite impressive this week. The annual gain of Annual Top 50 reduced to 49.52%.

1.2. Equity Top 50

Green and Amber color marked mutual funds in the list: Since the focus is not only looking for the performance leaders, but also consistent above average performance across all the timelines, the funds are marked in Green or Amber to easily recognize consistency of perfromance among the leaders.

Green: 

If the returns for all the available timelines from 1W thru 1Y is above the average within the list. The fund can not be marked green even with this rule if the returns are not available beyond a month, in which case the fund is marked as amber only.

Amber: 

If the returns for all the available timelines from 1W thru 1Y is above the average within the list except for one timeline. For this exception, if any of the weekly and monthly returns are above average, then both timelines are considered to have above average return.

1.2.1 Equity Weekly Top 50


1.2.2. Equity Monthly Top 50


1.2.3. Equity Annual Top 50


1.3. Equity Bottom 50

Both the weekly and monthly bottom 50 lists are leveraged to identify potential bearish reversal indications of the funds. This is done by marking above average annual return in bold and below average returns for the week and month. The funds with both weekly and monthy below average, but annual above average are marked in darker red, while the funds with only one of the weekly and monthly below averages but with above average annual return are marked in light red.

Annual bottom 50 funds list is used to recognize potential bullish reversal. Any fund with above average return for both the week and the month in the list is marked as grey indicating potential bullish reversal.

1.3.1. Equity Weekly Bottom 50


1.3.2. Equity Monthly Bottom 50


1.3.3. Equity Annual Bottom 50


2. Hybrid Funds

2.1. Hybrid Funds Summary


2.2. Hybrid Monthly Top 50


3. Debt Funds

3.1. Debt Funds Summary


3.2. Debt Monthy Top 50


4. Commodity Funds

4.1. Commodity Funds Summary


4.2. Commodity Monthly Top 50


5. Whether it is a weekly Top 50 MF report or special MF report, these are availble in the blog indicated below. Blogs are also rendered as videos (on Youtube and Instagram) for those not prefering to read.

Blog: NatsFunCorner! on Blogger

https://natsfuncorner.blogspot.com/

Other relevant Social Network Platform links:

Whatsapp Group: This whatsapp group is a peer group, people active in investment and trading (including day trading) are here, exchanging their insight and views. Please note that there is no room for promotional participation here. 

https://chat.whatsapp.com/IuzkVAHgn1jJ20ZmB8m9Vz

FB: https://www.facebook.com/nupadhya/

YouTube: https://www.youtube.com/user/nupadhya

Instagram: https://www.instagram.com/natsupadhya/

Twitter (X): https://twitter.com/nupadhya

LinkedIn: https: https://www.linkedin.com/in/nupadhya/


Disclaimer:

- This is not a solicitation for mutual fund investment nor an advice. It is only an insight to help investment decisions based on the free MF performance data downloaded from Value Research. Investment decisions are only yours to make.

- Mutual fund investments are subjected to market risk. Read the propsectus of a mutual fund for all the risk information associated prior to investment.

- The author can not be responsible for the ommissions or errors in the data from Value Research or the data processing errors if any by the author.

- All your investment decisions need to be based on your decision finally, with no blame to anyone else later.


Sunday, December 8, 2024

Special MF Report: Hybrid Funds Short Term & Long Term Top 50 Analysis as on Dec 06, 2024


Commentary:

1. Finally I have made an investment to buy paid subscription to an office software, with which I am able to combine tables. Hence forth, all mutual funds reports will combine short term (1W thru 1Yr) and long term (3 Yr thru 20 Yr) data in reporting, as shown above. (There is no hybrid fund data beyond 10 Yrs)

2. The last line at the table below gives average summary of all 220 hybrid funds across all the timelines. One can appreciate the variation of Top 50 summaries across all timelines against this benchmark.

3. Top 50 Hybrid Funds Analysis.

Top 50 funds list is given for 1 Month and 1 Yr in short term, 3Yr, 5 Yr and 10 Yr in long term.

Green and Amber color marked mutual funds in the list: Since the focus is not only looking for the performance leaders, but also consistent above average performance across all the timelines, the funds are marked in Green or Amber separately for short term and long term.

Green: 

Short term: If the returns for all the available timelines from 1W thru 1Y is above the average within the list. The fund can not be marked green even with this rule if the returns are not available beyond a month, in which case the fund is marked as amber only.

Long Term: If the returns for all the available timelines from 3Y thru 10Y is above the average within the list. 

Amber: 

Short Term: If the returns for all the available timelines from 1W thru 1Y is above the average within the list except for one timeline. For this exception, if any of the weekly and monthly returns are above average, then both timelines are considered to have above average return.

Long Term: If the returns for all the available timelines from 1W thru 1Y is above the average within the list except for one timeline. 

These color codes help to avoid investing in a fund due to a furious short term or long term bullishness and then getting stuck beyond with underperformance.

Also, maintaining color codes separately for short term and long term help to distinguish performance leadership and consistance of performance across short term and long term separately.


3.1. Monthly Top 50:


3.2. Annual Top 50:


3.3. 3 Yr Top 50:


3.4. 5 Yr. Top 50:


3.5. 10 Yr Top 50:


4. Whether it is a weekly Top 50 MF report or special MF report, these are availble in the blog indicated below. Blogs are also rendered as videos (on Youtube and Instagram) for those not prefering to read.

Blog: NatsFunCorner! on Blogger

https://natsfuncorner.blogspot.com/

Other relevant Social Network Platform links:

Whatsapp Group: This whatsapp group is a peer group, people active in investment and trading (including day trading) are here, exchanging their insight and views. Please note that there is no room for promotional participation here. 

https://chat.whatsapp.com/IuzkVAHgn1jJ20ZmB8m9Vz

FB: https://www.facebook.com/nupadhya/

YouTube: https://www.youtube.com/user/nupadhya

Instagram: https://www.instagram.com/natsupadhya/

Twitter (X): https://twitter.com/nupadhya

LinkedIn: https: https://www.linkedin.com/in/nupadhya/


Disclaimer:

- This is not a solicitation for mutual fund investment nor an advice. It is only an insight to help investment decisions based on the free MF performance data downloaded from Value Research. Investment decisions are only yours to make.

- Mutual fund investments are subjected to market risk. Read the propsectus of a mutual fund for all the risk information associated prior to investment.

- The author can not be responsible for the ommissions or errors in the data from Value Research or the data processing errors if any by the author.

- All your investment decisions need to be based on your decision finally, with no blame to anyone else later.


Friday, December 6, 2024

Special MF Report: Post event knee-jerk reaction valuation after RBI monitory policy announcement & weekly Top 50 funds analysis combined as on Dec 06, 2024


Commentary:

1. Post event Knee-jerk reaction summary:

For this we are comparing the mutual fund performance summary as of  EOD on Dec 6, 2024 against as of EOD Dec 5, 2024 and evaluating the gain or loss on Dec 6, 2024 due to the RBI monitory policy announcement.

As anticipated, RBI announcement was in line with majority expectations of the market with CRR rate reduced by 50 basis point leading to liquidity for the banks. No change in reverse repo rate as anticipated. So, bottom line the market corrected a bit post announcement as the news was already accounted before and some profit booking occurred.

Looking at the summary of two tables above, the overall equity mutual funds return average reduced from 3.08 to 2.74 for the week, 2.97 to 1.70 for the month. So, there was a knee jerk reaction as anticipated, primarily due to the correction equities held by the funds.

Weekly Top 50 made better gains though as the distinction between weekly winners Vs. the rest became more pronounced.

There is some uncertainity as to whether the equity funds will maintain the upward trajectory for the next two weeks, so caution suggested.

2. Equity Top 50 Analysis

Green and Amber marked mutual funds in the list: Since the focus is not only looking for the performance leaders, but also consistent above average performance across all the timelines from 1W thru 1Y, the consistency of performance is highlighted for eligible funds with green and amber color as follows:

Green: If the returns for all the available timelines is above the average within the list. The fund can not be marked green even with this rule if the returns are not available beyond a month, in which case the fund is marked as amber only.

Amber: If the returns for all the available timelines is above the average within the list except for one timeline. For this exception, if any of the weekly and monthly returns are above average, then both timelines are considered to have above average return.

These color codes help to avoid investing in a fund due to a furious short term bullishness and then getting stuck beyond with underperformance.

2.1. Weekly Top 50:

To assess the knee jerk reaction, one can compare with the weekly Top 50 a day before as given before, and it is evident that some funds like Motilal Oswal Mid Cap fund slipped from top 50 list due to post event correction, which benefitted IT based funds to come into the list.


2.2. Monthly Top 50:

To assess the post event knee jerk reaction, one can compare with the Monthly Top 50 list a day before, and can see the impact. For example, White Oak Bharat Digital fund saw erosion of gains both weekly and monthly.


2.3. Annual Top 50:

To assess the knee jerk reaction post event, one can compare with the annual top 50 list a day before. For example, the Motilal Oswal Mid Cap fund on the third row saw loss of gains both on weekly and monthly basis though it did not impact the annual gains, which means short term gainers corrected within the fund while the long term gainers did not.


3. Equity Bottom 50 Analysis:

Weekly and monhly bottom 50 funds are used to recognize potential bearish reversal. This is done by identifying below average weekly and monthly returns and above average annual returns. Funds with above average annual return and with both weekly and monthly return below average are marked in darker red, while any one of the weekly and monthly return is below average, marked with light red.

Annual bottom 50 funds list is used to recognize potential bullish reversal. Any fund with above average return for both the week and the month in the list is marked as grey indicating potential bullish reversal.

3.1. Weekly Bottom 50:


3.2. Monthly Bottom 50:


3.3. Annual Bottom 50:
4. Hybrid Funds:

4.1. Hybrid Funds Summary:


4.2. Hybrid Funds Monthly Top 50:


5. Debt Funds

5.1. Debt Funds Summary:


5.2. Debt Monthly Top 50:

6. Commodity Funds

6.1. Commodity Funds Summary:

6.2. Commodity Monthly Top 50:

7. Whether it is a weekly Top 50 MF report or special MF report, these are availble in the blog indicated below. Blogs are also rendered as videos (on Youtube and Instagram) for those not prefering to read.

Blog: NatsFunCorner! on Blogger

https://natsfuncorner.blogspot.com/

Other relevant Social Network Platform links:

Whatsapp Group: This whatsapp group is a peer group, people active in investment and trading (including day trading) are here, exchanging their insight and views. Please note that there is no room for promotional participation here. 

https://chat.whatsapp.com/IuzkVAHgn1jJ20ZmB8m9Vz

FB: https://www.facebook.com/nupadhya/

YouTube: https://www.youtube.com/user/nupadhya

Instagram: https://www.instagram.com/natsupadhya/

Twitter (X): https://twitter.com/nupadhya

LinkedIn: https: https://www.linkedin.com/in/nupadhya/


Disclaimer:

- This is not a solicitation for mutual fund investment nor an advice. It is only an insight to help investment decisions based on the free MF performance data downloaded from Value Research. Investment decisions are only yours to make.

- Mutual fund investments are subjected to market risk. Read the propsectus of a mutual fund for all the risk information associated prior to investment.

- The author can not be responsible for the ommissions or errors in the data from Value Research or the data processing errors if any by the author.

- All your investment decisions need to be based on your decision finally, with no blame to anyone else later.


Thursday, December 5, 2024

Special MF Report: Baseline MF Performance metrics in anticipation of market knee-jerk reaction to anticipated RBI announcement on Dec 6, 2024


Commentary:

1. Context of this special report:

The Indian equities have been recovering for the last two weeks including this week. The recent equity correction before that has been attributed two major facts: i. Indian GDP growth and the company revenue/profits slowed down thru Q2. ii. Trump win at the US presidential election has sent a bullish wave for the US market, attracting funds flow away from emerging markets, dollar strength is historically high now, can go further high in short future.

After the worst is over, India is recovering slowly on equities in anticipation of Q3 recovery. Rupee is slowly depreciating against dollar, which may be good news for exports, but bad news for imports, and overall India's imports overweighing  exports, it is a concern.

In the mean time, the current governer of the RBI's term ends by Dec 12th, and this is the last major announcement of RBI before that on Dec 6th. 

The market has already anticipated the following as part of this Dec 6th announcement by RBI:

1. Major boost to the liquidity in the economy by cutting the CRR rate by 50%

2. Due to inflation concerns and Rupee devaluation concerns, the Repo rate will not be cut now, and maintained at 6.5%.

Indian equity market went bullish in the last four sessions of the week, in anticipation of the above announcement.  So, post RBI announcement, the following outcomes could be there:

1. Disappointment to the market, causing a significant correction, especially if the CRR rate is not cut.

2. Jubiliation by the market if the rate cut extends to Repo Rate too, in which case there will be jubiliation for the export oriented sectors like IT and interest rate sensitive sectors like real estate, and some correction on import heavy sectors.

3. Neutral reaction as the market has anticipated the announcements, therefore market will behave sideways with a neutral stance on the announcements, with some profit taking for the week may be, leading to a minor pull back.

So, the objective is to take a snapshot of mutual fund performance prior to the announcement and then assess the kneejerk reaction if any, after the last session of the week. Therefore, one more special report will emerge a day after, assessing the knee jerk reaction to the RBI announcement.

Also, another objective is whether to pre-invest in some specific mutual funds with reasonable risk. This is important for me as I have waited against post correction equity mutual fund investments till now, for better clarity as to consistency in the rebound of mutual funds. So, I am ready to make some investment today (which may get invested by funds only on Monday) ahead of the RBI announcements. Please check my assessment statement in this regard at the end of this report.

1.  Top 50 Mutual Fund lists

Green and Amber marked mutual funds in the list: Since the focus is not only looking for the performance leaders, but also consistent above average performance across all the timelines from 1W thru 1Y, the consistency of performance is highlighted for eligible funds with green and amber color as follows:

1. Green: If the returns for all the available timelines is above the average within the list. The fund can not be marked green even with this rule if the returns are not available beyond a month, in which case the fund is marked as amber only.

2. Amber: If the returns for all the available timelines is above the average within the list except for one timeline. For this exception, if any of the weekly and monthly returns are above average, then both timelines are considered to have above average return.

These color codes help to avoid investing in a fund due to a furious short term bullishness and then getting stuck beyond with underperformance.

1.1. Weekly Top 50:


1.2. Monthly Top 50:


1.3. Annual Top 50:


2. Conclusion as to pre-investment before RBI announcement on Dec 6, 2024:

It is clear to me that the following mutual fund investments prior to the announcement are reasonable and risk balanced as follows:

2.1. US equity based funds, especially the Mirae Asset NYSE FANG+ETF one, being the top in all three Top 50 lists above.

2.2. Motilal Oswal Mid Cap fund, which is green in the annual list, and amber in the other two lists with reasonable short term returns across 1W and 1M.

3. Whether it is a weekly Top 50 MF report or special MF report, these are availble in the blog indicated below. Blogs are also rendered as videos (on Youtube and Instagram) for those not prefering to read.

Blog: NatsFunCorner! on Blogger

https://natsfuncorner.blogspot.com/

Other relevant Social Network Platform links:

Whatsapp Group: This whatsapp group is a peer group, people active in investment and trading (including day trading) are here, exchanging their insight and views. Please note that there is no room for promotional participation here. 

https://chat.whatsapp.com/IuzkVAHgn1jJ20ZmB8m9Vz

FB: https://www.facebook.com/nupadhya/

YouTube: https://www.youtube.com/user/nupadhya

Instagram: https://www.instagram.com/natsupadhya/

Twitter (X): https://twitter.com/nupadhya

LinkedIn: https: https://www.linkedin.com/in/nupadhya/


Disclaimer:

- This is not a solicitation for mutual fund investment nor an advice. It is only an insight to help investment decisions based on the free MF performance data downloaded from Value Research. Investment decisions are only yours to make.

- Mutual fund investments are subjected to market risk. Read the propsectus of a mutual fund for all the risk information associated prior to investment.

- The author can not be responsible for the ommissions or errors in the data from Value Research or the data processing errors if any by the author.

- All your investment decisions need to be based on your decision finally, with no blame to anyone else later.