Friday, July 26, 2024

Monthly Top 50 Mutual Funds Analysis as on July 27, 2024


Commentary:

1. Though there was a bit of negative sentiment post the budget annuouncement as a knee jerk reaction, the negative sentiment was totally wiped out on the equity market on the last two days sessions of the week.

2. As a result, the equity mutual funds ended with good returns for the week and the month. So, were the hybrid funds. However, the commodity funds suffered further thru the week due to international gold prices correcting further, over and above the budget impact. However, the Gold prices improved overnight on Friday in the international market, hence we can see some rebound on the commodity funds thru next week.

3. Decision is to add one more feature in the Top 50 report from this week onwards, which is to accomodate the funds which fail to have above average return in one of the timelines from 1M thru 1Y, and highlighted in amber as a result. The considerations for marking the fund green remain the same, which is to have above average retruns in all timelines from 1M thru 1Y. If the fund is reasonably new, it needs to have at least 1M and 3M data above average to deserve a green status, funds with only 1M data above average will continue to be marked as amber.


4. Looking at the Monthly Top 50, IT/Tech funds still rule, Pharma/Healthcare funds coming in, and a few consumption and value funds. Recently launched IT/Tech funds got green status as they do not have the subpar annual or six months data pulling down.


5. Monthly Bottom 50 list is to appreciate the positive trend reversal, or continuation of negative trend of some funds. For this the rule is further refined from this week onwards, which is that the fund in the list needs to have above average annual return (Marked Black Bold) and it needs to have below average return either for the week or the month. (Marked in the Bold Red). The funds identified this way are marked in Red Bold. 

6. A bunch of Bank ETFs are still in the monthly bottom 50 list, and though have negative returns for the month and week, they are above the bottom 50 averages. So, hope of reversal ahead is alive for them.

7. Looking at the Annual Top 50 equity funds list, Nifty auto ETF funds show the promise of domination again.


8. Looking at the Annual Bottom 50, attempt is to highlight the potential turn around on the under performers by highlighting those funds which have above average return either on the weekly column or the monthly column. May be, the worst is over for the bunch of Bank ETFs shown in the bottom of the list in bold.


9. Looking at the Hybrid Monthly Top 50, the distinction between the Green and Amber color is the same as in the Equity funds list.


10. Looking at the Hybrid Annual Top 50,  the distinction between the Green and Amber color is the same as in the Equity funds list.

11. Looking at the Commodities Top list above, in spite of heavy corrections, the green and amber ones give clarity as to the priority for reinvestment at botttom prices.

Disclaimer:

- This is not a solicitation for mutual fund investment nor an advice. It is only an insight to help investment decisions based on the free MF performance data downloaded from Value Research. Investment decisions are only yours to make.

- Mutual fund investments are subjected to market risk. Read the propsectus of a mutual fund for all the risk information associated prior to investment.

- The author can not be responsible for the ommissions or errors in the data from Value Research or the data processing errors if any by the author.

- All your investment decisions need to be based on your decision finally, with no blame to anyone else later.

Tuesday, July 23, 2024

Special MF Report - Assessing the Knee Jerk reaction of Mutual Fund performances due to the budget news on July 23, 2024


Commentary:

1. This is an observational excercize out of curiosity. The mutual fund performances are compared across the two days, one before the budget news and the one after the budget news. While one can not attribute the key changes across the rolling returns across a day, it is an attempt to assess the overall sentiment of the mutual funds after the budget news.

2. It can be argued that there is minimal correlation between the performance of debt and commodity funds and the budget news. Incidentally, both the fund types corrected across a day on most of the timeframes (except the debt fund returns on monthly basis was bit higher). The correction of commodity funds across a day is shocking, which was actually due to the budget news that the import duty on gold and silver cut to 5%, so the decline was immediate thru the budget day.

3. So, the comparison across the two days need to be done primarily on equity funds and hybrid funds. Here again, the performance of the hybrid funds is impacted due to that of equity and debt portion, both of which corrected through the day with some exceptions.

4. When it comes to the equity funds, the performance correction is out there across the two days, except the following: 

4.a. When it comes to the entire equity funds scope across 860 funds, better performance lingered on 6M timeline only. What this means is that the funds that did better in the last 6M fared better post budget news. -

4.b. The monthly top 50 funds gave better returns across all the timelines. What this means is that there has been a specific focus as to the performance leadership post budget news, resulting in better performance of those new performance leaders. We will drill down to the weekly and monthly top 50 list to assess this further.

4.c. The monthly bottom 50 funds gave mixed returns, better returns on 6M and 1Y only, while corrected on other short term timelines. What this means is that the annual top performers corrected further through the day causing this divergence. It is fair to say, therefore that some amount of jumping the ship is happening with annual Top 50 mutual funds investments.

4.d. When it comes to the annual Top 50 funds, the performance deteriorated in all timelines except for the 6M return. What this means is that the funds which did better 6M before suffered more in comparison, which means the recent 6M trendheld up better in comparison.

4.e. When it comes to the annual bottom 50 funds, performance improved on 1W, 6M and 1Y timelines, while it suffered on 1M and 3M timelines. What this means is that the underperformers for the last 1M and 3M fared better in comparison.

5. In summary, the equity mutual fund performances overall suffered a minor correction post budget news.

We will compare weekly leaders across equity and hybrid segments, to assess specific impact on leadership.


6. First, let us compare the weekly Top 50 averages across all timelines across these two dates, one before the budget, and one after the budget.

6.a. Weekly averages improved on all timelines from 1M thru 1Y. What this means is that the mutual funds contined their faith in their new focus post budget too. There is not much surprise here which could be also because of the inertia of mutual funds to react fast.

6.b. The weekly performance leaders getting the green status due to above average performance across 1M thru 1Y remained pretty much the same.

Let us do the Weekly Bottom 50 comparison too, for any perspective if any.


7. Comparing the weekly bottom 50 across the two dates, the following observations can be found.

7.a. The bottom 50 funds corrected more on timelines 1W, 1M and 3M, they showed better returns on the 6M and 1Y timelines. What this means is that correction hit more on those who were performing better 6M before. 

7.b. Both the tables attempt a divergence by highlighting below average weekly return in Bold Red and Above average annual return in Bold Black. Those funds which have both the featurs are marked in Bold Red. While, the pre budget list had only one fund, two more such funds were coming into this divergence list post budget, that too relating to infrastructure and PSU.  So, the disappointment on all these three funds is recconfirmed. 

8. Overall Summary:

While the overall market sentiment declined post budget news, the most recent performance leaders remained to dominate the performance. 

There needs to be caution as to the 6M and 1Y performance leaders to suffer further correction ahead.

The disappointment on Defence, Realty, Infrastructure and PSU can not be ignored.

Please note the limitation of this study is to observe the potential knee jerk reaction over only one day. Mutual funds could be far more lethargic to react than in one day. Also, other factors other than budget might have influenced the results.

Disclaimer:

- This is not a solicitation for mutual fund investment nor an advice. It is only an insight to help investment decisions based on the free MF performance data downloaded from Value Research. Investment decisions are only yours to make.

- Mutual fund investments are subjected to market risk. Read the propsectus of a mutual fund for all the risk information associated prior to investment.

- The author can not be responsible for the ommissions or errors in the data from Value Research or the data processing errors if any by the author.

- All your investment decisions need to be based on your decision finally, with no blame to anyone else later.


Friday, July 19, 2024

Monthly Top 50 Mutual Funds Analysis for the week ending July 19, 2024


Commentary:

1. The mutual funds performance was subdued for the second week now. Still, the Monthly Top 50 equity funds registered a healthy 10.06% average return.


2. Looking at the Equity Monthly Top 50, the list is dominated by the IT and Tech funds. However, only two funds came into green status for having above average returns across 1M thru 1Y.


3. Looking at the Equity Monthly Bottom 50 for the trend reversal signs. The funds with below average Monthly Return and above average annual return within the list are marked in bold red and bold black respectively. The funds meeting both the criteria are likely the reversal candidates. HDFC Defence fund has appeared in this list. (I personally will cash out on this fund now).


4. Looking at the Equity Annual Top 50 funds, one can see the short term slow down on these funds. Very few funds made it to the green status for having above average return from 1M thru 1Y.


5. Equity Annual Bottom 50 list is pursued to identify poterntial reversals within the laggards. The funds with above average monthly return and above average annual return are shown in bold. These funds are worthy to watch out for further reversal from underperformance. 


6. There is some leadership churn out on the Hybrid Monthly Top 50 list. The ones marked in the green are those having above average returns from 1M thru 1Y timelines.


7. One can see that the top three funds in the Hybrid Annual Top 50 failed to make it to green status due to short term performance issues. The one in the green are those having above average returns for the timelines 1M thru 1Y.


8. At least two commodity funds made it to the green status, for having above average returns in timelines 1M thru 1Y.

Disclaimer:

- This is not a solicitation for mutual fund investment nor an advice. It is only an insight to help investment decisions based on the free MF performance data downloaded from Value Research. Investment decisions are only yours to make.

- Mutual fund investments are subjected to market risk. Read the propsectus of a mutual fund for all the risk information associated prior to investment.

- The author can not be responsible for the ommissions or errors in the data from Value Research or the data processing errors if any by the author.

- All your investment decisions need to be based on your decision finally, with no blame to anyone else later.

Saturday, July 13, 2024

Monthly Top 50 Mutual Funds Analysis for the week ending with July 12, 2024


Commentary:

1. All types of mutual funds had a positive week and month on average. But the returns were bit subdued compared to the previous week.

2. Among the equity funds, the Monthly Top 50 were more aggressive than the Annual Top 50, which means there is a constant churn out as to the performance leaders when compared to the past.


3. Looking at the equity funds monthly Top 50, only one fund made it to the investment grade (shown in green) for having above average return in all timelines from 1M thru 1Y. Even there, the annual return has faded from 147+ to 132+, which means the fund had an impressive return 53 weeks back, hence it may start fading a bit on a large base of historic return.

4. The monthly Top 50 equity funds are filled with many IT ETF funds, in spite of nice monthly return, they still are underpeforming for the timelines beyond. So, one needs to be cautious as to whether they will remain profitable by waiting for them to have above average returns in 3M timeline too, which may take another two months to confirm that.

5. Looking at the equity Monthly bottom 50, the monthly returns below the average of bottom 50 are marked in Bold, and the funds with such returns but having above average annual returns are marked in red. What this means is that these past performers are slowing down significantly. You may watch these funds for another three weeks or so, and confirm whether the downtrend remains, then it is an option to churn them out to protect the historic profits. Such funds marked are Real Estate and Auto ETF funds.


6. Looking at the Annual Top 50 funds, the funds marked in green are the ones having above average returns for the timelines 1M thru 1Y.


7. Looking at the Annual Bottom 50 equity funds, the funds marked in bold are the ones having above average monthly returns within the bottom 50. These are likely the recovery candidates ahead, one needs to watch them for another three weeks or so to reconfirm the trend reversal for better. One can only say that the worst is over for these, and not necessarily these are investment bets.


8. Looking at the hybrid monthly Top 50, the investment worthy ones are marked in green for having above average returns in timelines 1M thru 1Y.


9. Looking at the Hybrid Annual Top 50, the investment worthy ones are marked in green for having above average returns from 1M thru 1Y timelines.


10. Looking at the Commodities funds, investment worthy ones are marked in green for having above average returns from 1M thru 1Y.

 Disclaimer:

- This is not a solicitation for mutual fund investment nor an advice. It is only an insight to help investment decisions based on the free MF performance data downloaded from Value Research. Investment decisions are only yours to make.

- Mutual fund investments are subjected to market risk. Read the propsectus of a mutual fund for all the risk information associated prior to investment.

- The author can not be responsible for the ommissions or errors in the data from Value Research or the data processing errors if any by the author.

- All your investment decisions need to be based on your decision finally, with no blame to anyone else later.

Sunday, July 7, 2024

Special Mutual Funds Report - Last 6 Months Performance Leaders in the Indian Equity Funds - As on July 5, 2024


Commentary:

1. Given above are the averages of the equity mutual funds by sub fund types.

2. Value Research looks at equity funds into broadly two categories: Sectoral, Thematic and International into one, and then the rest. Hence the averages are given both by these two types and the fund sub types below both these titles.

3. So, when we look at the combination of funds, we get three combinations, all equity funds (854), Sectoral, Thematic and International Combined (357) and the Rest (497). Of course, the 6M reutrn is the best when you look at the Top 50 of all 854 equity funds. But from a comparative study, Sectoral, Thematic and International together gave better Top 50 six month return. 

4. When we look at the entire mutual funds scope 6M return average, Rest other than Sectoral, Thematic and International performed better than both all combined and the Sectoral, Thematic and International.

5. The overall ranking of the 6M Average Returns of all fund sub types are given at the extreme right.  Thematic PSU funds gave the best returns followed by Sectoral Infrastructure funds followed by Mid Cap funds.

6. The worst 6M average returns were given by the Sectoral Banking (Rank 20) followed by the Sectoral Tech followed by International equity funds.


7. Looking at the Top 50 funds across all equity funds, the ones marked are the green are the ones having above average returns across 1M thru 1Y. They are likely to remain good bets for furrher investments till the trend changes.


8. Looking at the Bottom 50 funds across all equity funds based on 6M Return, the ones with better average monthly return are marked in bold. It is worth waiting to see whether their uptrends will hold further. While these funds will take some more time to be marked as investment worthy (green), at least those holding these can hold longer with hope of better returns ahead.


9. Looking at the combined Sectoral, Thematic and International funds together, the ones marked in green are the those having above average returns from 1M thru 1Y timeline.


10. Looking at the bottom 50 of Sectoral, Thematic and International combined, those with monthly return above the average are marked in Bold. One can hope to see further recovery on such funds, if still holding.


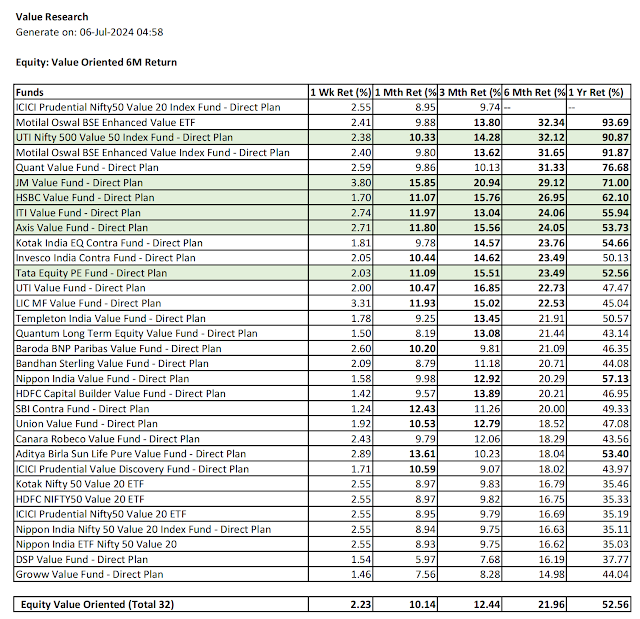
11. Looking at the 6M Top 50 of Rest of the funds combined except Sectoral, Thematic and Internationa, the ones marked in green are those having above average return for all the timelines from 1M thru 1Y.


12. Looking at the bottom 50 based on 6M return on the Rest of the funds combined except for Sectoral, Thematic and Intrenational, the ones marked in bold are those giving above average monthly returns, ones holding these can hold longer therefore in hope of further recovery.

Now follows the 6M Return analysis of all 20 equity fund sub types:

13. Large Cap:


14. Large & Mid Cap:


15. Flexi Cap


16. Multi Cap


17. Mid Cap:


18. Small Cap:


19. Value Oriented:


20. ELSS


21. Sectoral - Banking:


22. Sectoral - Infrastructure


23. Sectoral - Pharma


24. Sectoral - Technology


25. Thematic General


26. Thematic Consumption:


27. Thematic Dividend Yield


28. Thematic Energy


29. Thematic ESG:


30. Thematic MNC:


31. Thematic PSU:


32. International:


 Disclaimer:

- This is not a solicitation for mutual fund investment nor an advice. It is only an insight to help investment decisions based on the free MF performance data downloaded from Value Research. Investment decisions are only yours to make.

- Mutual fund investments are subjected to market risk. Read the propsectus of a mutual fund for all the risk information associated prior to investment.

- The author can not be responsible for the ommissions or errors in the data from Value Research or the data processing errors if any by the author.

- All your investment decisions need to be based on your decision finally, with no blame to anyone else later.