Saturday, July 13, 2024

Monthly Top 50 Mutual Funds Analysis for the week ending with July 12, 2024


Commentary:

1. All types of mutual funds had a positive week and month on average. But the returns were bit subdued compared to the previous week.

2. Among the equity funds, the Monthly Top 50 were more aggressive than the Annual Top 50, which means there is a constant churn out as to the performance leaders when compared to the past.


3. Looking at the equity funds monthly Top 50, only one fund made it to the investment grade (shown in green) for having above average return in all timelines from 1M thru 1Y. Even there, the annual return has faded from 147+ to 132+, which means the fund had an impressive return 53 weeks back, hence it may start fading a bit on a large base of historic return.

4. The monthly Top 50 equity funds are filled with many IT ETF funds, in spite of nice monthly return, they still are underpeforming for the timelines beyond. So, one needs to be cautious as to whether they will remain profitable by waiting for them to have above average returns in 3M timeline too, which may take another two months to confirm that.

5. Looking at the equity Monthly bottom 50, the monthly returns below the average of bottom 50 are marked in Bold, and the funds with such returns but having above average annual returns are marked in red. What this means is that these past performers are slowing down significantly. You may watch these funds for another three weeks or so, and confirm whether the downtrend remains, then it is an option to churn them out to protect the historic profits. Such funds marked are Real Estate and Auto ETF funds.


6. Looking at the Annual Top 50 funds, the funds marked in green are the ones having above average returns for the timelines 1M thru 1Y.


7. Looking at the Annual Bottom 50 equity funds, the funds marked in bold are the ones having above average monthly returns within the bottom 50. These are likely the recovery candidates ahead, one needs to watch them for another three weeks or so to reconfirm the trend reversal for better. One can only say that the worst is over for these, and not necessarily these are investment bets.


8. Looking at the hybrid monthly Top 50, the investment worthy ones are marked in green for having above average returns in timelines 1M thru 1Y.


9. Looking at the Hybrid Annual Top 50, the investment worthy ones are marked in green for having above average returns from 1M thru 1Y timelines.


10. Looking at the Commodities funds, investment worthy ones are marked in green for having above average returns from 1M thru 1Y.

 Disclaimer:

- This is not a solicitation for mutual fund investment nor an advice. It is only an insight to help investment decisions based on the free MF performance data downloaded from Value Research. Investment decisions are only yours to make.

- Mutual fund investments are subjected to market risk. Read the propsectus of a mutual fund for all the risk information associated prior to investment.

- The author can not be responsible for the ommissions or errors in the data from Value Research or the data processing errors if any by the author.

- All your investment decisions need to be based on your decision finally, with no blame to anyone else later.

Sunday, July 7, 2024

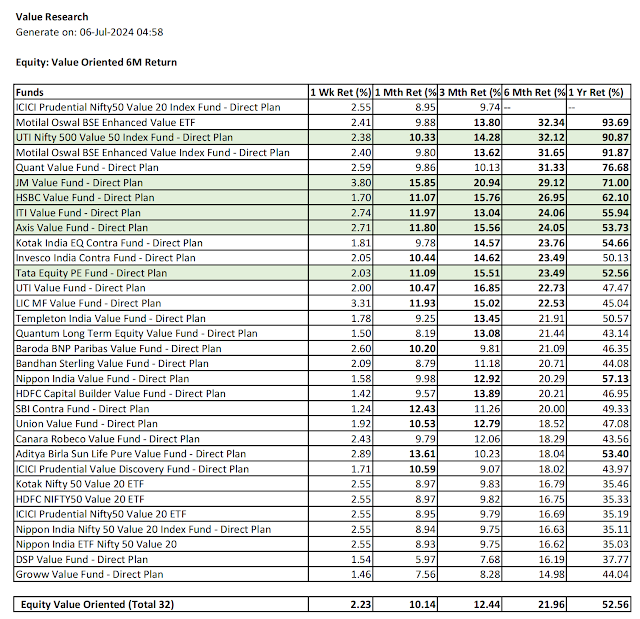
Special Mutual Funds Report - Last 6 Months Performance Leaders in the Indian Equity Funds - As on July 5, 2024


Commentary:

1. Given above are the averages of the equity mutual funds by sub fund types.

2. Value Research looks at equity funds into broadly two categories: Sectoral, Thematic and International into one, and then the rest. Hence the averages are given both by these two types and the fund sub types below both these titles.

3. So, when we look at the combination of funds, we get three combinations, all equity funds (854), Sectoral, Thematic and International Combined (357) and the Rest (497). Of course, the 6M reutrn is the best when you look at the Top 50 of all 854 equity funds. But from a comparative study, Sectoral, Thematic and International together gave better Top 50 six month return. 

4. When we look at the entire mutual funds scope 6M return average, Rest other than Sectoral, Thematic and International performed better than both all combined and the Sectoral, Thematic and International.

5. The overall ranking of the 6M Average Returns of all fund sub types are given at the extreme right.  Thematic PSU funds gave the best returns followed by Sectoral Infrastructure funds followed by Mid Cap funds.

6. The worst 6M average returns were given by the Sectoral Banking (Rank 20) followed by the Sectoral Tech followed by International equity funds.


7. Looking at the Top 50 funds across all equity funds, the ones marked are the green are the ones having above average returns across 1M thru 1Y. They are likely to remain good bets for furrher investments till the trend changes.


8. Looking at the Bottom 50 funds across all equity funds based on 6M Return, the ones with better average monthly return are marked in bold. It is worth waiting to see whether their uptrends will hold further. While these funds will take some more time to be marked as investment worthy (green), at least those holding these can hold longer with hope of better returns ahead.


9. Looking at the combined Sectoral, Thematic and International funds together, the ones marked in green are the those having above average returns from 1M thru 1Y timeline.


10. Looking at the bottom 50 of Sectoral, Thematic and International combined, those with monthly return above the average are marked in Bold. One can hope to see further recovery on such funds, if still holding.


11. Looking at the 6M Top 50 of Rest of the funds combined except Sectoral, Thematic and Internationa, the ones marked in green are those having above average return for all the timelines from 1M thru 1Y.


12. Looking at the bottom 50 based on 6M return on the Rest of the funds combined except for Sectoral, Thematic and Intrenational, the ones marked in bold are those giving above average monthly returns, ones holding these can hold longer therefore in hope of further recovery.

Now follows the 6M Return analysis of all 20 equity fund sub types:

13. Large Cap:


14. Large & Mid Cap:


15. Flexi Cap


16. Multi Cap


17. Mid Cap:


18. Small Cap:


19. Value Oriented:


20. ELSS


21. Sectoral - Banking:


22. Sectoral - Infrastructure


23. Sectoral - Pharma


24. Sectoral - Technology


25. Thematic General


26. Thematic Consumption:


27. Thematic Dividend Yield


28. Thematic Energy


29. Thematic ESG:


30. Thematic MNC:


31. Thematic PSU:


32. International:


 Disclaimer:

- This is not a solicitation for mutual fund investment nor an advice. It is only an insight to help investment decisions based on the free MF performance data downloaded from Value Research. Investment decisions are only yours to make.

- Mutual fund investments are subjected to market risk. Read the propsectus of a mutual fund for all the risk information associated prior to investment.

- The author can not be responsible for the ommissions or errors in the data from Value Research or the data processing errors if any by the author.

- All your investment decisions need to be based on your decision finally, with no blame to anyone else later.

Friday, July 5, 2024

Monthly Top 50 Mutual Funds Analysis as on July 5, 2024


Commentary:

1. All types of mutual funds had a positive return both for the week and the month, resulting in one of the best weeks for the mutual funds in general.

2. Bottom 50 funds analysis is focused on only equity funds going forward, from this report as the leverage is more with such a focus.


3. Looking at the Monthly Top 50 equity funds, top fund returned an annual return of record 147.04%, thanks to the defence stocks returns.

4. The funds marked in green are the ones having above average returns from timelines 1M thru 1Y, definitely investment worthy ones.

5. Because the funds at the top of the list had significant gain, the averages moved up, hence the funds in green are a few inspite of a great week.

6. Therefore, one would get more investment worthy ones if willing to losen the tough benchmark imposed here, which is to have above average returns across 1M thru 1Y. For example: LIC MF Small Cap Fund, Canara Robeco Infrastructure Fund.


7. Analysis of the Monthly Bottom 50 equity funds is to appreciate as to which funds are way underperforming against the general trend.

8. The returns below the average are marked in red, and those funds having below average return across all timelines from 1M thru 1Y are marked in Red.

9. When one focuses on certain thematic funds, need to stay off such underperformances, simply by selling off, as there is so much opportunity to go behind the winners.


10. Looking at the Equity Annual Top 50, the ones marked in green do have above average returns from 1M thru 1Y timelines.

11. Again, one may find many other funds than the one in green if compromise on the tough rule applied here. For example: CPSE ETF, SBI Psu Fund

12. The caution stated through the last two weeks reports on the monthly bottom 50 worked out. Many of the annual Top 50 leaders were stuck in the Monthly Bottom 50, and as anticipated, all of them have come out of monthly bottom 50. Further, some of them even made it to the Monthly Top 50 this time. So, the lesson is not to fall for the flash in the pan performance, whether it is bullish or bearish. At least a month level consideration is a must, even for the underperformers. But, this analysis takes much tougher stand, which is to highlight consistent superior performance across all timelines from 1M thru 1Y, which makes sense when one has limited money to invest and has more than a dozen choices through every weekly analysis report.


13. Looking at the Annual Bottom 50 equity funds, the returns above the bottom average are are marked in bold Navy Blue. The purpose is to appreciate which of the bottom 50 may be attempting to buck the down trend. The funds having above average returns within bottom 50 are also marked in Navy Blue Bold. If you are stuck with some of these funds, better give some more time before selling off to see whether they can recover better ahead.


14. Looking at the Hybrid Top 50, both across Monthly and Annually, the funds with above average returns for all timelines from 1M thru 1Y are marked in green.


15. The commodity funds had a recovery thru this week. Need to see whether this is kind of a dead cat bounce given significant corrections through last one month or so. Global realities around commodities dint change much except for the crude prices going up, which might have flared inflation fears a bit, hence benefit to the gold and silver prices too. Further, there has been a setback for the current US president on the first presidential candidate debate, which might have sent some uncertainity for the US market, which typically flares up inflation fears a bit.  Need to see, whether commodities are worthy of reinvestment ahead, but I personally stay off as I have better risk adjusted returns through Indian equity funds. For a short while I did consider commodity funds when the equity funds were bit lagging, from March thru April 2024, till the election results in the first week of May 2024.

16. Also note that the Indian commodity funds focus only on Gold and Silver, and nothing else, which I wonder why. While the India has a full fledged commodity exchange (eg. MCX), wonder why there is no foray into various commodity funds, especially the ones more relevant to the India realities like Agri commodities, ferrous metals, aluminium, crude etc. I am noting this here, as a mind trigger sent as a wave towards further reform in the Indian mutual funds market. For now, my assumption is that it is the typical lethargy or apathy or inertia of the regulator body and therefore the Industry in general, and I may be wrong.

 Disclaimer:

- This is not a solicitation for mutual fund investment nor an advice. It is only an insight to help investment decisions based on the free MF performance data downloaded from Value Research. Investment decisions are only yours to make.

- Mutual fund investments are subjected to market risk. Read the propsectus of a mutual fund for all the risk information associated prior to investment.

- The author can not be responsible for the ommissions or errors in the data from Value Research or the data processing errors if any by the author.

- All your investment decisions need to be based on your decision finally, with no blame to anyone else later.

Saturday, June 29, 2024

Monthly Top 50 Mutual Funds Analysis as on June 28, 2024


Commentary:

1. All the fund types advanced both for the week and the month on average, except for the commodity funds.

2. Monthly Top 50s made better progress for the week and the month when compared to the annual Top 50s, therefore we can anticpate churn out in monthly Top 50 leaders.

3. Both equity funds and hybrid funds Top 50 for the month and year maintained their average return levels. Hence, overall the equity funds and hybrid funds remained bullish.


4. Looking at the Monthly Top 50 funds across all fund types, it is mostly equity funds except for one Hybrid fund in the list like last week report. The IT / Tech / Digital funds had remarkable recovery for the week and the month, but given the poor returns thru 3M/6M/1Y timelines, only one fund made it to the investment grade so far. Many Large Cap / Mid Cap / Small Cap funds made to the Top 50 list through this time.

5.  With above average returns within the Top 50 across all the timelines from 1M thru 1Y, very few funds made to the investment grade, and are marked in green. There is a definite churn out in leadership here, which means market leadership is rotating across scripts and therefore funds. So, there is a level of unsettling feeling for all except for those marked in green. 


6. In contrast, the annual Top 50 across all fund types leadership is somewhat stable, totally dominated by equity funds.

7. The investment worthy ones are marked in green for having above average returns across timelines 1M through 1Y, and these funds belong to defence, infrastructure and power.


8. Looking at the Monthly Top 50 equity funds list, there is only one change which is to replace the lonely hybrid fund with an equity fund when compared to the similar list across all fund types. Hence there is minor changes in the investment grade ones marked in green. Incidently, the Top fund among these green ones is a Mid Cap fund.


9. Looking at the equity Monthly bottom 50, there are many annual leaders stuck here with poor monthly returns, which is a concern as to whether their attractiveness is getting over. As mentioned last week, we better wait for another two weeks minimum before rushing to exit such funds, marked in red in the list. Most of them are either PSU or PSU Bank funds. So watch out for their performance through next two weeks.

10. There is no need to discuss Equity Annual Top 50 funds list separately, as it is the same as the annual Top 50 across all fund types.


11. For the first time, annual bottom 50 equity funds list is given above, mainly to appreciate the type of funds which are recovering from the dump, and are marked in Bold Dark Blue. Can't help noticing the recovery of FMCG, Private Bank ETFs in this list.


12. Top 50 hybrid funds both for the month and year have maintained their usual trends. The investment worthy ones are marked in green for having above average returns across 1M thru 1Y timelines.


13. Commodity funds list remains boring for correction both in weekly and monthly basis. Further, with continued leadership churn out, none of the funds make it to the investment worthiness as there is no consistent above average return across 1M thru 1Y for any fund. So, the old glory is wearing out for all the funds, more for some, and less for some.

Disclaimer:

- This is not a solicitation for mutual fund investment nor an advice. It is only an insight to help investment decisions based on the free MF performance data downloaded from Value Research. Investment decisions are only yours to make.

- Mutual fund investments are subjected to market risk. Read the propsectus of a mutual fund for all the risk information associated prior to investment.

- The author can not be responsible for the ommissions or errors in the data from Value Research or the data processing errors if any by the author.

- All your investment decisions need to be based on your decision finally, with no blame to anyone else later.