Commentary:
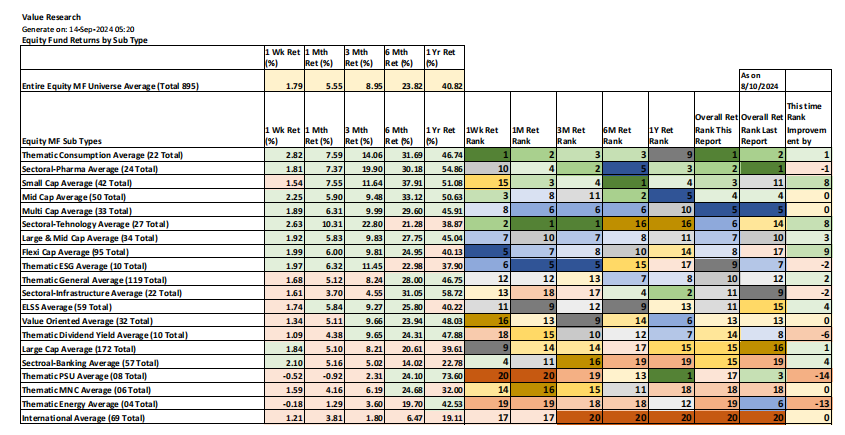
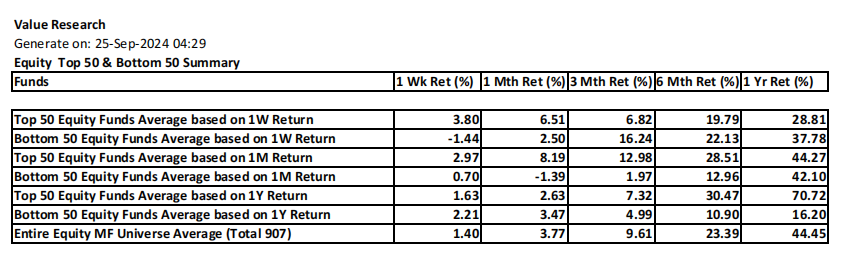
1. The Equity Top 50 Summary is given as on both Sept 27 the Friday and Sept 24 the Tuesday. Looking at the Sept 27th Summary on stand alone basis, the bull run of the Equity market is spreading further on the funds. While the annual return average of all equity funds is around 40% in general, there is a spread of this number from approx. 35% to 45% between short term bearish outlook to bullish outlook in the market. So, we may see further bull run ahead to stretch the overall annual return of all equity funds together beyond 45% in coming weeks.
2. Looking at the Equity Top 50 Summary across both Sept 27 and Sept 25 together, comparing ther overall Equity funds universe (911 Vs 907 funds), there is a further expansion of returns % beyond 3 months in the recent report, but there is a lesser return for 1W and 1M basis. What it tells is that, overall bull run intensity is slowing down since Sept 25th, so very short term, we may see some tapering of the bull run while it steams ahead. Need to validate this hunch further through next week summary report.
3. However, when we compare the returns across Top 50 and Bottom 50 sections across two timelines, there is a marked improvement in the recent report in general, which means that the bull run is benefitting more in focusing on the Top 50 for now.


4. Looking at the Hybrid Top 50 Summary across Sept 27th Vs Sept 24th, the bull run continues in general. But its intensity is slowing down both in the overall cateogry and different Top 50 catergory, in all timelines from 1W thru 6M, but the 1Y return has improved in the most recent report. What it means is that annual leaders have some time delay in catching up on the bull run effect. It is not possible to distinguish the impact of equity portion Vs. debt portion in the behavior of hybrid funds here. So, we may get some clarity by looking at debt funds alone in addition to equity funds alone.


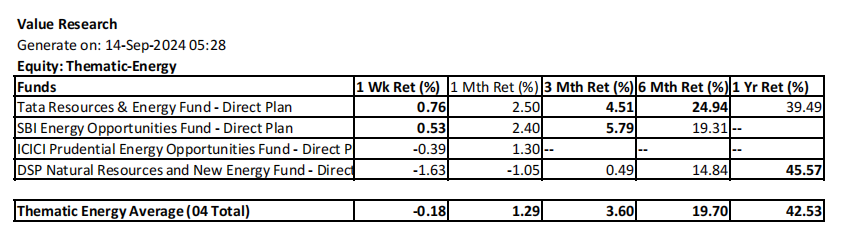
6. Comparing the Commodities summary across Sept 27th Vs Sept 24th, bull run is further intensified later in all timeline categories.
7. Because of the onset of bull run in all fund categories, this kind of detailed analysis is done at summary level, as this is an unique opportunty to do so.
8. From this report onwards, the rule for assigning green and amber status is kept further refined and the same for all fund types, which primarily includes 1W performance too into consideration.
8.1. Green status is given only if the returns in the Top 50 list is above the average within the list in all timelines from 1W thru 1Y.
8.2. Amber status is given only if the return in the Top 50 list is above the average within the list in all timelines from 1W thru 1Y except for one timeline. Here another exception is that in case 1M or 1W timeline fails to be above average, grace consideration is given if the other among the two is above the average.
8.3. In case the mutual fund is very recent and the data is not available beyond 1M, even if both the 1W and 1M data are above average, still amber status is given for lack of longer term data. But, green status is given if all timelines averages are above average even if the data availability is restricted upto 3 months or 6 months only.
8.4. If this logic sounds too complicated, the bottom line is that the funds with green are very consistent in higher performance in all timelines from 1W thru 1Y, and are rock solid for fresh investment considerations. When it comes to those in amber, they too can be treated as investment worthy if the short term returns (1W and/or 1M) too are above average.

9. Looking at the Weekly Top 50 Equity funds list, Chinese Hangseng ETF based funds can be considered for short term investments as the short returns are phenomenal (eg. weekly 24.32%) while this bull runs lasts and it may not last long, at least at this intensity level.
10. Other than the Hangseng ETF, metal ETFs are also showing significant metal in short term investment focus. Other than that, emerging market funds, PSU funds, Auto ETFs, Momentum ETFs, Alpha ETFs are showing attractiveness for short term investments (Difficult to confirm the same for longer terms) for exploitation till the bull run lasts. It is confusing time for longer term investors as there is no guarantee as to how long the current bull run lasts to count on specific fund types, such persons could count on Annual Top 50 list alone therefore.

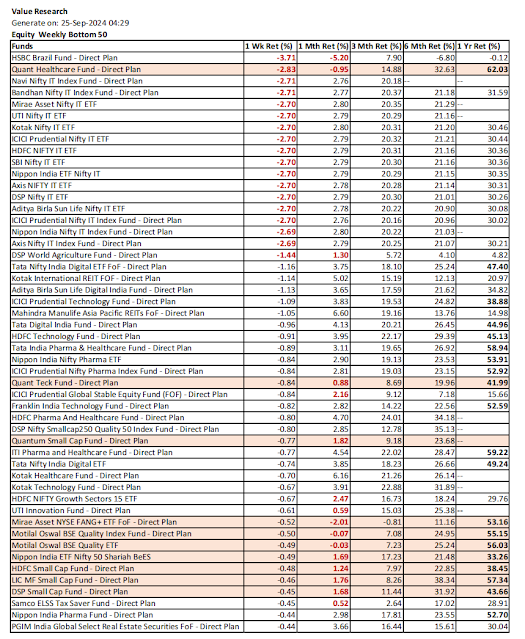
11. Weekly Bottom 50 Equity funds list is looked into for the bearish reversal signs relatively speaking. A fund is marked in red if the annual return is above average and either of the weekly and monthly return is below the average (marked in Red Bold). Certain Consumption, Technology, Small Cap, Multi Cap, Alpha funds are caught up here, which means these fund types are losing shine relatively speaking as other fund types are gaining momentum.

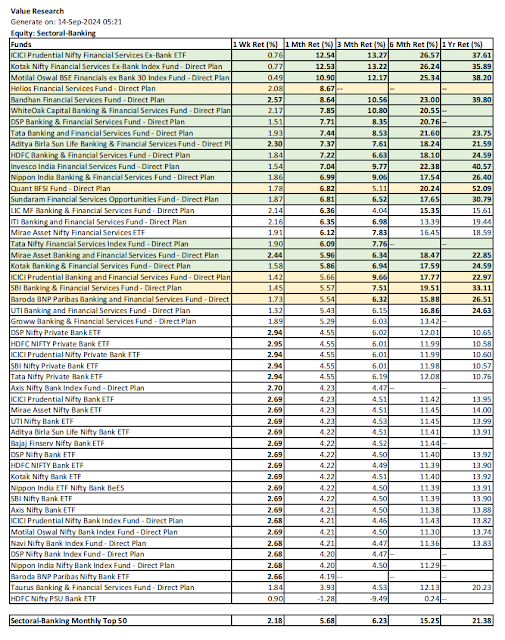
12. Looking at the Monthly Top 50 equity funds list, the attractiveness short term is HangSeng, Auto, Metal, Flexi/Multi Cap, Consumption, Financial Services.

13. Looking at the Monthly Bottom 50 Equity funds list, bearish reversal can be seen on certain PSU, Defence, Flexi Cap, Small Cap, Quant, Innovation, Value, Infrastructure funds. This observation is very volatile ahead as the bull run on equity may continue with some sector rotations and underperforming funds so far may catch up better.

14. Looking at the Annual Top 50 Equity, Bandhan Small Cap fund slips into Amber here too, mainly due to change in our rule for Green consideration, which is to include 1W performance too. Certain Next 50 type funds stand green and tall with better returns across both short term and longer term.

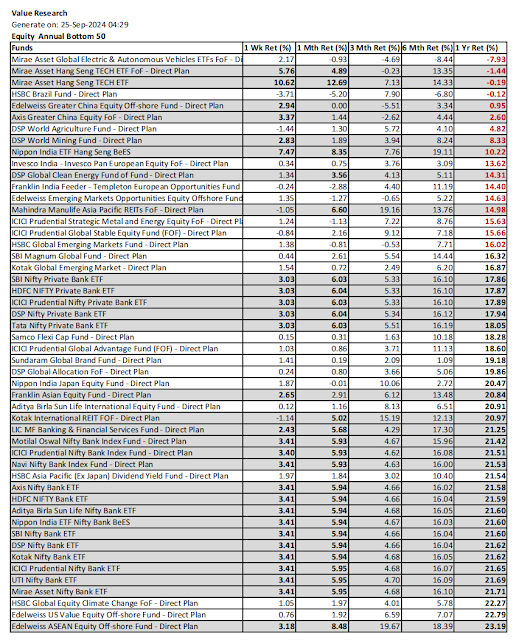
15. Equity Annual Bottom 50 list is leveraged to sense bullish reversal in progress for the annually under performing funds. Such funds are marked in Grey for having above average weekly or monthly return within the list. Again, emerging market especially China recovery is reiterated here.


16. When it comes to Hybrid funds, the Top 50 list is given this time for three timelines 1W, 1M and 1Y, mainly to appreciate any divergence of short term leadership Vs. longer for the interested parties. Limitation here is that only aggressive type funds make into the list given the equity bull run much overpowering than the debt funds bull run due to interest rate cuts.


18. With continued bull run in commodities too, there is clear distinction emerging among the funds with Green and Amber distinction.
19. Whether it is a weekly Top 50 MF report or special MF report, these are availble in the blog indicated below. Blogs are also rendered as videos for those not prefering to read.
Blog: NatsFunCorner! on Blogger
https://natsfuncorner.blogspot.com/
Other relevant Social Network Platform links:
Whatsapp Group: This whatsapp group is a peer group, people active in investment and trading (including day trading) are here, exchanging their insight and views. Please note that there is no room for promotional participation here.
https://chat.whatsapp.com/IuzkVAHgn1jJ20ZmB8m9Vz
FB: https://www.facebook.com/nupadhya/
YouTube: https://www.youtube.com/user/nupadhya
Instagram: https://www.instagram.com/natsupadhya/
Twitter (X): https://twitter.com/nupadhya
LinkedIn: https: https://www.linkedin.com/in/nupadhya/
Disclaimer:
- This is not a solicitation for mutual fund investment nor an advice. It is only an insight to help investment decisions based on the free MF performance data downloaded from Value Research. Investment decisions are only yours to make.
- Mutual fund investments are subjected to market risk. Read the propsectus of a mutual fund for all the risk information associated prior to investment.
- The author can not be responsible for the ommissions or errors in the data from Value Research or the data processing errors if any by the author.
- All your investment decisions need to be based on your decision finally, with no blame to anyone else later.