Commentary:
1. Promise is to provide the detailed equity funds returns analysis by sub-type at least once a month, and here is the Sept 2024 edition.
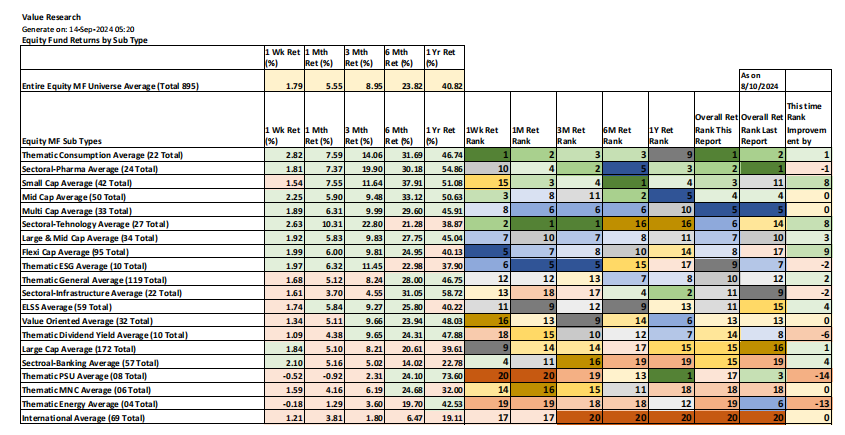
2. The equity fund sub-types are ranked by their returns for all the timelines from 1W thru 1Y. Then the overall rank is arrived by taking an average rank across all the timelines. The fund subtypes are then sorted in the assending order of overall rank, meaning the fund types at the top are overall better performers across all the timelines considered.
3. Let us digest the fund sub type overall return rankings this time:
Top 5 (Ranking 1-5):
Consumption
Pharma
Small Cap
Mid Cap
Multi Cap
Next Top 5 (Ranking 6-10):
Technology
Large & Mid Cap
Flexi Cap
ESG
Thematic General
Next Top 5 (Ranking 11-15):
Infrastructure
ELSS
Value Oriented
Dividend Yield
Large Cap
Bottom 5 (Ranking 16-20)
Banking
PSU
MNC
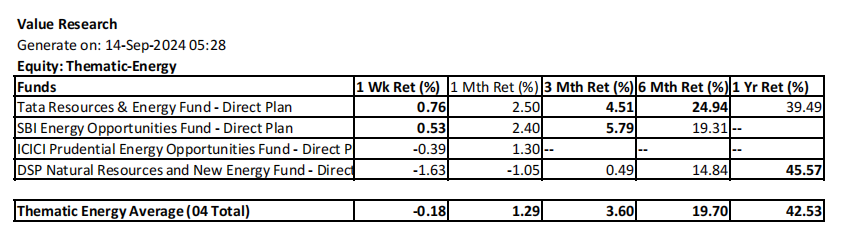
Energy
International
4. Since we had generated similar report last month (As on Aug 10,2024), we can therefore analyse the relative ranking improvement and slippage since last report.
Fund sub types with ranking improvements (Ranking improvement steps in parantheses)
More than 5 steps ranking improvement by:
Flexi Cap (Improvement by 9 steps)
Small Cap (Improvement by 8 steps)
Technology (Improvement by 8 steps)
One to five steps ranking improvement by:
ELSS (Improvement by 4 steps)
Banking (Improvement by 4 steps)
Large & Mid Cap (Improvement by 3 steps)
Thematic General (Improvement by 2 steps)
Consumption (Improvement by 1 step)
Large Cap (Improvement by 1 step)
No ranking improvement or slippage by:
Mid Cap
Multi Cap
Value Oriented
MNC
International
Ranking Slippage upto 5 steps down
Pharma (Slippage by 1 step)
ESG (Slippage by 2 steps)
ELSS (Slippage by 2 steps)
Ranking Slippage between 6-10 Steps down
Dividend Yield (Slippage by 6 steps)
Ranking Slippage by more than 10 Steps down
Energy (Slippage by 13 steps)
PSU (Slippage by 14 steps)
Obviously, those holding Energy and PSU funds suffered significant losses on accumulated gains through the last one month.
5. Please note the average equity funds return given for all the timelines at the top, and marked in Amber. When it comes to the sub types, superior returns when compared to this average are marked in Green and sub-par returns are marked in Red. This way, you can assess how a sub type has fared relatively better or worse in a particular timeline when compared to the overall equity funds returns average. Obviously, one will see more red color as one goes down the list, and more green color as one goes up the list by sub-type. Green color at the bottom portion and red color at the top portion are anamolies, and need to be looked into for appreciating their deviation from the overall rank level expectations.
6. For each sub-type, the overall ranking for the particular timeline is marked (from 1 to 20). In case if same level of ranking is achieved (which can happen in overall ranking) across more than one fund sub-type, then a particular ranking is skipped. For example, Infrastructure and ELSS got overall ranking of 11, therefore ranking 12 is skipped.
7. By looking at this overall returns summary table at this level of detail, one can master the changes that have come into the performance of equity funds by sub-type. By moving with the returns changes of the fund sub-types, one gets to do better on key decisions, Buy, Hold and Sell toward better portfolio returns.
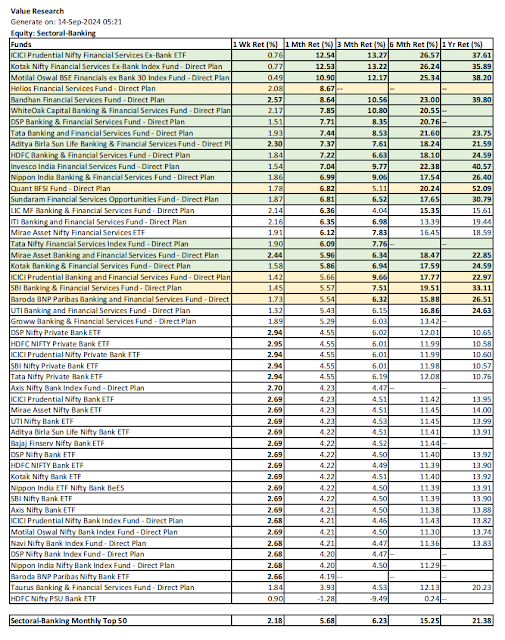
8. However, one needs to distinguish the superior or sub-par return of a particular fund irrespective of the sub-type rankings. Therefore, not to lose the ball on superior performers in general across all fund sub types, the top 50 equity funds both by month and year are re-attached below.


Please note that the green color is assigned to those funds which have above average return in all timelines from 1M thru 1Y. Amber color is assigned to those with above average return in all timelines from 1M thru 1Y except for one timeline. In case of recently launched fund with performance data for only one month, such fund is still marked as Amber as an exception than green for not having return information beyond a month.
The funds with green color here are investment worthy. The funds that are green in both the Monthly Top 50 and Annual Top 50 are far more preferred as they are rock solid by ensuring consistent return on both the lists. The one in amber can be considered only if one can rationalize the underperformance in a particular timeline. The one in amber are definitely Hold candidates. Monthly Bottom 50 list given in the weekly review can be used for Sell decisions, which is not a relevant focus here.
9. The performance review by Fund Sub-Type: Totally 20 fund sub types.
When it comes to the fund sub-types, the color green and amber assigned with same logic. However, the key difference to consider is that a fund in a sub-type may not be considered investment worthy just for getting the green status, as it is only a relative superior consistent performance within a fund sub type. The overall return of a fund in spite of green status can be sub-par as the overall performance of fund sub type also is sub-par.
The fund performance by fund sub-type is discussed in the assending order of overall performance ranking, which means that the fund sub-types discussed early on are better performers overall.
All the fund sub-type returns are sorted by the descending order of Monthly Return.
Also, please note that only top 50 funds based on Monthly return are given for those sub-types having more than 50 funds. Therefore, if you are holding a fund that does not appear in top 50 by monthly return, you wont be able to trace its peformance metric. You should be concerned for your fund not appearing in Top 50, and pursue the Hold Vs. Sell decision as part of your portfolio management. Please note that the following sub-types have more than 50 funds and you may miss to see a particular fund you hold from these sub-type lists.
Flexi Cap
Thematic General
ELSS
Large Cap
Banking
International
9.1. Consumption

9.2. Pharma

9.3. Small Cap

9.4. Mid Cap

9.5. Multi-Cap

9.6. Technology

9.7. Large & Mid Cap

9.8. Flexi Cap

9.9. ESG

9.10. Thematic General

9.11. Infrastructure

9.12. ELSS

9.13. Value Oriented

9.14. Dividend Yield

9.15. Large Cap

9.16. Banking
9.17. PSU

9.18. MNC

9.19. Energy
9.20. International

10. You can anticipate weekly blog, as well as this type special MF reports in all of my social network platforms. These blogs are also rendered as videos for those not prefering to read.
Blog: NatsFunCorner! on Blogger
https://natsfuncorner.blogspot.com/
Whatsapp Group: This whatsapp group is a peer group, people active in investment and trading (including day trading) are here, exchanging their insight and views. Please note that there is no room for promotional participation here.
https://chat.whatsapp.com/IuzkVAHgn1jJ20ZmB8m9Vz
FB: https://www.facebook.com/nupadhya/
YouTube: https://www.youtube.com/user/nupadhya
Instagram: https://www.instagram.com/natsupadhya/
Twitter (X): https://twitter.com/nupadhya
LinkedIn: https: https://www.linkedin.com/in/nupadhya/
Disclaimer:
- This is not a solicitation for mutual fund investment nor an advice. It is only an insight to help investment decisions based on the free MF performance data downloaded from Value Research. Investment decisions are only yours to make.
- Mutual fund investments are subjected to market risk. Read the propsectus of a mutual fund for all the risk information associated prior to investment.
- The author can not be responsible for the ommissions or errors in the data from Value Research or the data processing errors if any by the author.
- All your investment decisions need to be based on your decision finally, with no blame to anyone else later.
No comments:
Post a Comment