Friday, June 21, 2024

Monthly Top 50 Mutual Funds Analysis as on June 21, 2024


1. All fund types had a weekly gain on average, all the fund types had positive monthly average except for the commodity funds.

2. Annual leaders made less progress in the month when compared to the monthly leaders. So, there is a transition of top 50 leaders in general.


3. Looking at the monthly Top 50 across all fund types, it is dominated by equity funds (except for one hybrid fund - SBI Magnum Children Plan - Investment). Investment worthy ones for having above average returns for all timelines 1M thru 1Y are marked in green. Please have a look at the rest of the rows also, as it gives you an idea as to how the leadership trend is churning. For example, one can see emergence of small cap funds, private psu bank funds, flexi cap funds etc.


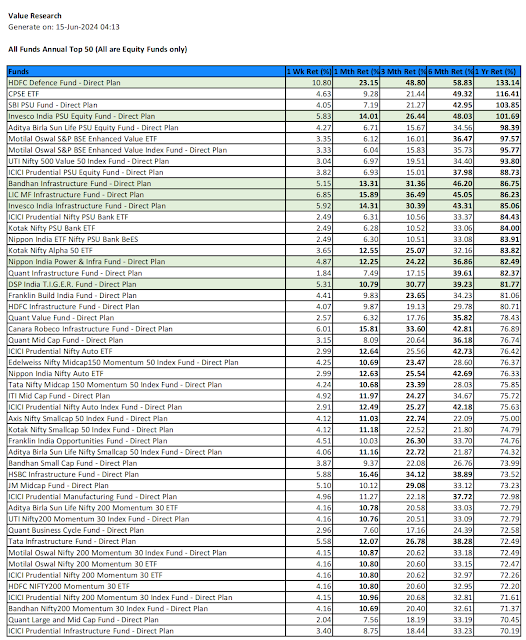
4. Looking at the annual Top 50 across all fund types, it is pretty much the same as equity annual top 50. Investment worthy ones marked in green for having above average returns from 1M thru 1Y are from defence and infrastructure. One can also see small cap, flexi cap, nifty auto funds in the top 50.


5. Looking at the Equity only Monthly Top 50, the investment worthy ones marked in green for having above average returns from 1M thru 1Y timelines belong to Defence, Realty, Mid Cap, Small Cap, Housing etc.  The ones marked in yellow are promising but do not have performance data beyond 1 month.


6. Looking at the Equity Monthly Bottom 50, note worthy ones are marked in red. Some annual return leaders are stuck here, which is a concern. Need to watch these funds performance for next two weeks, if underperformance continues, the annual gains will erode fast, then selling these funds may be prudent. Better decision to be taken at the weekend after budget.

7. There is no need to discuss equity only Annual Top 50, as it is the same as the Annual Top 50 across all fund types, and is given above.


8. Looking at the Hybrid Monthly Top 50, investment worthy ones are marked in green for having above average returns from 1M thru 1Y.


9. Looking at the Hybrid Annual Top 50, investment worthy ones are marked in green for having above average returns from 1M thru 1Y.


10. Looking at the Commodities funds, there is a churn out in the leadership. While there is some weekly recovery, overall the fund monthly average is negative. There is no green rows here as there is no single fund with above average return from 1M thru 1Y.


Disclaimer:

- This is not a solicitation for mutual fund investment nor an advice. It is only an insight to help investment decisions based on the free MF performance data downloaded from Value Research. Investment decisions are only yours to make.

- Mutual fund investments are subjected to market risk. Read the propsectus of a mutual fund for all the risk information associated prior to investment.

- The author can not be responsible for the ommissions or errors in the data from Value Research or the data processing errors if any by the author.

- All your investment decisions need to be based on your decision finally, with no blame to anyone else later.

Friday, June 14, 2024

Monthly Top 50 MF Analysis as on June 14, 2024


Commentary:

1. On average, all fund types except for the commodity funds appreciated, commodities continue to correct.

2. Both the Monthly Top 50 and Annual Top 50 funds across all fund types are represented by equity only. This reconfirms the recovery of equity continuing.


3. Looking at the Monthly Top 50 across all fund types, both the weekly and monthly returns are very nice. Investment worthy ones are marked in green for having above average return in all timelines from 1M thru 1Y. The ones marked in the Yellow are also leading ones, except they lack data beyond one month for being new funds. Risk takers can consider those too.


4. Looking at the Annual Top 50 across all fund types, the investment worthy ones are marked in green.

Equity Top 50 Analysis:

5. There is no need for separate Equity Top 50 analysis as equities totally dominated all fund types top 50.


6. Looking at the Hybrid Top 50, hybrid funds appreciated both on weekly and monthly basis, thanks to equity recovery. The investment worthy ones are marked in green.


7. Looking at the Hybrid Annual Top 50, the investment worthy ones are marked in green.


8. Looking at the Commodity Top funds, there is a divergence between weekly trend and monthly trend. There has been significant correction thru last week. Also, going by the global cues, the commodity funds perk up due to inflation fears and war fears, both of which are getting contained. Therefore, there can be more risk than reward in further investment into commodities in near future. Personally, I have sold all my investments in commodity mutual funds as I like to move that amount into equity now, as the equity short term correction seems to be over for now. 

Those who rode on the commodities through the last  6 months, that too in the last three months, made good return, 12.64% for three months, 16.26% for six months, which look far better on annual basis, kind of golden era for commodity funds, and that era may be getting over.


Disclaimer:

- This is not a solicitation for mutual fund investment nor an advice. It is only an insight to help investment decisions based on the free MF performance data downloaded from Value Research. Investment decisions are only yours to make.

- Mutual fund investments are subjected to market risk. Read the propsectus of a mutual fund for all the risk information associated prior to investment.

- The author can not be responsible for the ommissions or errors in the data from Value Research or the data processing errors if any by the author.

- All your investment decisions need to be based on your decision finally, with no blame to anyone else later.

Sunday, June 9, 2024

Special MF Report - Top Hybrid Funds by Hybrid Fund types as on June 7, 2024


Disclaimer:

- This is not a solicitation for mutual fund investment nor an advice. It is only an insight to help investment decisions based on the free MF performance data downloaded from Value Research. Investment decisions are only yours to make.

- Mutual fund investments are subjected to market risk. Read the propsectus of a mutual fund for all the risk information associated prior to investment.

- The author can not be responsible for the ommissions or errors in the data from Value Research or the data processing errors if any by the author.

- All your investment decisions need to be based on your decision finally, with no blame to anyone else later.


Commentary:

1. Hybrid funds are considered for better risk management against equity funds at lowered returns. Since equity funds can correct significantly through bearish phase, hybrid funds are considered to manage such risks as they contain non equity portion like debt or commodity instruments which have far more stable returns though those returns are lower to equity returns.

There are different types of hybrid funds with different risk appetite. While aggressive, multi asset allocation, and dynamic asset allocation fund types have maximum equity exposure, the balanced hybrid funds have moderate, and the rest which are hybrid conservative, hybrid equity savings types have much lesser equity exposure. The Hybrid Arbitrage type has the lowest equity exposure, and is considered for returning slightly higher return than debt funds.  The returns of hybrid funds reduce as the equity exposure reduces, which you can check in the average return by fund type above.

Depending on one's portfolio strategy, one may consider hybrid funds for 0-40% of their mutual fund investments. 

Through investment in suitable hybrid funds, one can indirectly invest in debt and commodity instruments too, that way separate investment in debt funds or commodity funds can be ignored.


2. Out of all the 218 hybrid funds, the table above gives to the Top 50 with highest monthly return. The investment worthy ones are marked in green for having above average returns for timelines 1M thru 1Y.


3. The table above gives the annual top 50 hybrid funds, the investment worthy ones are marked in green.


4. The table above gives the top 50 hybrid funds based on the average of the returns from 1W thru 1Y. Investment worthy ones are marked in green for having average return above the Top 50 average.

5. The Top 50 funds analysis across all hybrid funds do not help those who like to stay conservative by looking at conservative hybrid fund types. Hence, hybrid fund type based discussion follows.


6. The table above gives the investment worthy aggressvie hybrid funds in green.


7. The table above gives the investment worthy balanced hybrid funds in green.


8. The table above gives the investment worthy conservative hybrid funds in green.


9. The table above gives the investment worthy Equity Savings hybrid funds in green.


10. The table above gives the investment worthy Arbitrage hybrid funds in green.


11. The table above gives the investment worthy Dynamic Asset Allocation hybrid funds in green.


12. The table above gives the investment worthy Multi Asset Allocation hybrid funds in green.

Saturday, June 8, 2024

Special Equity MF Report - Top 50 funds and Investment choices by Equity Fund Types as on June 7, 2024


Commentary:

1. Since post election bearish sentiments have stabilized to approx. pre-election result levels, it is good time to look at equity funds performance by fund sub types. Similar analysis of hybrid funds too will be done soon.

2. Looking at the averages, the top 50 annual returns are in the following order:

    Equity All: 75.59%

    Equity Thematic: 59.62%

    Equity Large Cap, Large & Mid Cap: 59.30%

    Equity Mid & Small Cap: 58.31%

    Equity Sectoral: 55.89%

    Equity Flexi & Multi Cap: 46.28%

    Equity Value Oriented: 41.12%    

    Equity ELSS: 40.57%

3. For the last one month, the top 50 equity funds returned the following average returns:

    Equity All: 10.54%

    Equity Thematic: 9.75%

    Equity Large Cap, Large & Mid Cap: 8.17%

    Equity Mid & Small Cap: 7.95%

    Equity Flexi & Multi Cap: 6.73%

    Equity Sectoral: 6.87%

    Equity ELSS: 6.11%

    Equity Value Oriented: 5.55%

4. In order to assess the impact of election results through the last week, the top 50 funds weekly returns by fund types are as follows:

    Equity Sectoral: 4.37%

    Equity Thematic: 3.83%

    Equity Elss: 3.22%

    Equity All: 3.19%

    Equity Mid & Small Cap: 3.12%

    Equity Flexi & Mutlti Cap: 3.01%

    Equity Large Cap, Large & Mid Cap: 2.73%

    Equity Value Oriented: 2.93%

So, sectoral type equity funds have become more favorable since last one week.   


5. Looking at the All Equity Top 50 based on 1M Return, the investment worthy ones for having above average returns from 1M thru 1Y timelines are marked in green.


6. Looking at the All Equity Top 50 based on 1Y retun, the investment worthy ones are marked in green.


7. Looking at the Equity All Top 50 based on average of returns from timelines 1W thru 1Y, the investment worthy ones are marked in green.


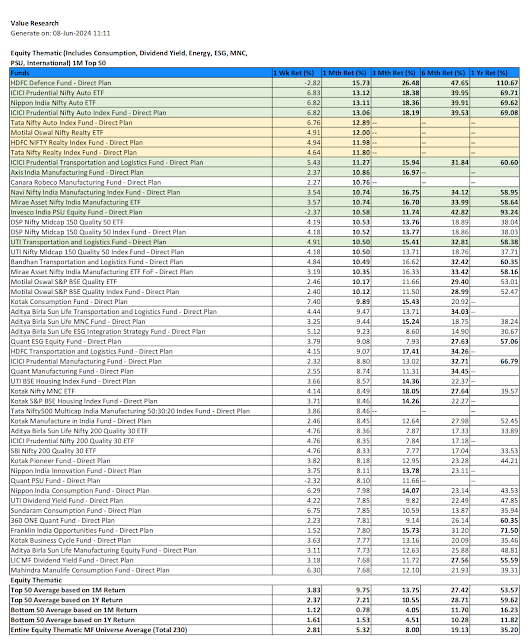
8. Looking at the Thematic Top 50 based on 1M return, the investment worthy ones are marked in green. The ones marked in yellow do not have return info beyond one month for being new funds, and while they have an aggressive return for the last one month, their consistency of performance for longer period needs to be tested.


9. Looking at the Thematic Top 50 based on 1Y return, investment worthy ones are marked in green.


10. Looking at the Top 50 of Large Cap and Large/Mid Cap based on 1M return, the investment worthy ones are marked in green.


11. Looking at the Top 50 of Large Cap and Large/Mid Cap based on 1Y return, the investment worthy ones are marked in green.


12. Looking at the Sectoral Top 50 based on 1M return, the investment worthy ones are marked in green.


13. Looking at the Sectoral Top 50 based on 1Y return, the investment worthy ones are marked in green.


14. Looking at the Flexi Cap and Multi Cap Top 50 based on 1M return, the investment worthy ones are marked in green.


15. Looking at the Flexi Cap and Multi Cap Top 50 based on 1Y return, the investment worthy ones are marked in green.


16. Looking at the Mid Cap & Small Cap Top 50 based on 1M return, investment worthy are marked in green.


17.  Looking at the Mid Cap & Small Cap Top 50 based on 1Y return, investment worthy are marked in green.


18. Looking at the ELSS (Tax Saver) Top 50 based on 1M return, the investment worthy ones are marked in green.


19. Looking at the ELSS (Tax Saver) Top 50 based on 1Y return, the investment worthy ones are marked in green.


20. Looking at the Value Oriented funds (only 32 out there), investment worthy ones are marked in green for having above average returns from 1M thru 1Y.

Tuesday, June 4, 2024

Special MF Report to assess impact of Lokasabha Election results and to choose fresh investments now!


Commentary:


Context:

    The Lokasabha election reconfirmed political stability at the cost of coalition government. Since exit polls caused euphoria a day before, there was a significant correction on June 4th. This could be an opportunity for fresh MF investments, if one knows which one to target.

Personally, I am bullish on mutual fund investments, and I like to bring in 40% new investments now, another 30% after government formation, and another 30% around the budget formation.

This report is for those who are aiming fresh investments, today. Focus here is only equity and hybrid funds.

1. Looking at the averages, we see negative returns for the equity and hybrid funds for the last one week in general, but the Top 50 averages for the week managed to stay positive.

2. But the annual leaders did suffer more correction than the average. Hence we need to anticipate leadership churn out, and therefore fresh insights for new investments.

This report also helps as a baseline in the weeks ahead, to assess the changes ahead due to further correction or recovery or leadership rotation.

This report only helps for fresh investments, it gives some clues as to which can be held and which need to be watched out for exit (bottom 50). But, it is advised that one does not exit any current MF investments till the budget process is completed through July, as one can anticipate recovery on underperformers.  

Methodology for fresh investments selection: We would consider three ways. 

Method 1: Looking at the above average returns if we take the average of performance from 1W thru 1Y. That way we account for this week performance too all the way to annual performance.


3. The rows in green above are investment worthy for having an above average return across all timelines 1W thru 1Y. They have been consistent in performance including the short 1W.

Method 2: Based on Monthly Perofrmance Leaders


4. The above picture is the Monthly Top performers for the last one month across all fund types. Only three funds made it to the investment grade for having above average returns across 1M thru 1Y.


5. In contrast, the above picture shows the bottom 50 across all fund types. We can see some of the usual top performers trapped here due to significant correction through last week. Since there could be further correction on these, better stay away from them short term.


6. When we look at Equity Only Top 50, good number of funds made it to the investment worthiness for having above average returns from 1M thru 1Y.


7. For those who like to consider hybrid funds which will have less aggressive returns, there is a leadership churnout due to recent correction. The ones which are investment worthy are marked green for having above average return from 1M thru 1Y.

Method 3: Based on 1 Year Return leaders


8. The aobe picture is the Top 50 funds with 1Year Return. Though it is across all fund types, all the leaders here are equity funds. So, no need to discuss equity only annual performace leaders separately. The investment worthy ones are marked in green for having above average return from 1M thru 1Y.


9. The above picture is the annual Top 50 for hybrid funds only. The investment worthy ones are marked in green, for having above average return for all timelines from 1M thru 1Y. You can see churn out in leadership here too.