Friday, August 30, 2024

Top 50 Mutual Funds Analysis as on Aug 30, 2024


Commentary:

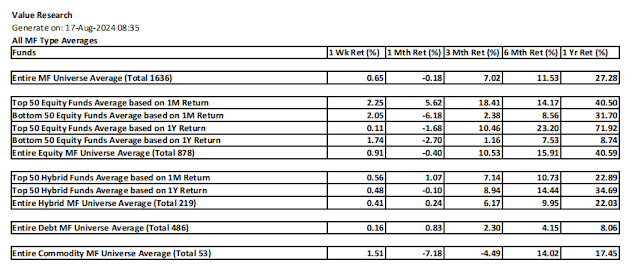
1. The mutual funds did well last week across the board.  The monthly average return of Top 50 Equity mutual funds is now bit subdued at 6.12% Top 50 Equity Annual Return is at 74.01. Overall annual average return of all equity funds is at 43.23% Annual Return Average of Equity Monthly Bottom 50 being more than that of Equity Monthly Top 50 is an indication of confirmation of change in leadership of superior returns short term.


2. Looking at the Monthly Top 50 Equity funds, the one in the green are those with above average return within the list for all timelines from 1M thru 1Y. The one in amber are those with above average returns in all timelines from 1M thru 1Y except for one timeline. Leadership of healthcare funds continues with some decline, but the Tech funds are more pronounced this week on their recent leadership. The two darlings from last week, HDFC Pharma fund and Bandhan SmallCap fund still remain in the green.


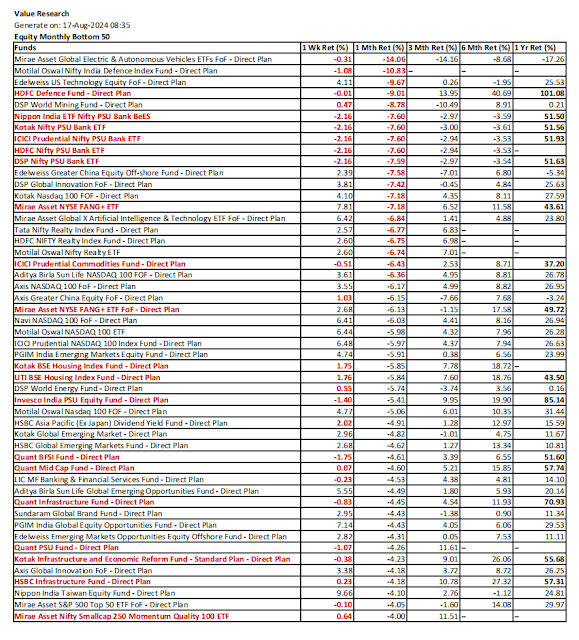
3. Purpose of Monthly Equity Bottom 50 list is to recognize potential bearish reversal of certain better performing funds. The above average annual return within the list is marked Bold Black, the below average weekly and monthly returns are marked Bold Red. Funds with above average annual return and below average weekly or monthly return are marked in Bold Red, indicating them as potential bearish reversal candidates. HDFC Defence fund still appears here, and one can see the erosion of its annual profit further. The other in the red belong to Infrastructure, PSU, Power, Realty, Manufacturing, Consumption, Large & Mid Cap. So, caution on these fund types.


4. Looking at the Annual Top 50, there is significant erosion as to the green status in the list given to sub par performance of many of the annual leaders. LIC MF Infrastructure Fund and Bandhan SmallCap Fund are shining bright with green status.


5. The purpose of the Equity Annual Bottom 50 list is to recognize the potential bullish reversal. The annual Returns is delinked for this computation. Any fund with above average weekly or monthly return within the list is marked in Bold Black. Looks like Nifty Bank ETFs are finally recovering, and their annual return percentage is also going up, but they are still in the bottom 50, so remain a watch item.

6. There is some churn out in the Monthly Top 50 leadership with green status on Hybrid funds. Bank of India Mid & Smal Cap Equity & Debt Fund in the green list has the highest annual return and is more favored.

7. Quant funds fail to make the green list in both the Monthly Top 50 and Annual Top 50, inspite of past good annual returns. So caution ahead.


8. There is lack of consistent leadership among Commodity funds, no fund made it to the green list.

9. You can anticipate this blog weekly, as well as the special MF reports in all of my social network platforms. These blogs are also rendered as videos for those not prefering to read.

Blog: NatsFunCorner! on Blogger

https://natsfuncorner.blogspot.com/

Whatsapp Group: This whatsapp group is a peer group, people active in investment and trading (including day trading) are here, exchanging their insight and views. Please note that there is no room for promotional participation here. 

https://chat.whatsapp.com/IuzkVAHgn1jJ20ZmB8m9Vz

FB: https://www.facebook.com/nupadhya/

YouTube: https://www.youtube.com/user/nupadhya

Instagram: https://www.instagram.com/natsupadhya/

Twitter (X): https://twitter.com/nupadhya

LinkedIn: https: https://www.linkedin.com/in/nupadhya/


Disclaimer:

- This is not a solicitation for mutual fund investment nor an advice. It is only an insight to help investment decisions based on the free MF performance data downloaded from Value Research. Investment decisions are only yours to make.

- Mutual fund investments are subjected to market risk. Read the propsectus of a mutual fund for all the risk information associated prior to investment.

- The author can not be responsible for the ommissions or errors in the data from Value Research or the data processing errors if any by the author.

- All your investment decisions need to be based on your decision finally, with no blame to anyone else later.


Tuesday, August 27, 2024

Special MF Report: Detailed Debt Funds Performance Analysis by Sub-Type as on Aug 23, 2024


Commentary:

1.  There is anticipation of interest rate reductions globally ahead. Such a move impacts the debt funds short term. This is because the price of debt instrument is usually 100-the coupon rate, which is the associated interest rate. So, when the interest rate falls, the bond price goes up accordingly and vice versa. The bond funds tend to leverage this move for their investors. This report serves as a basline for comparison later as the interest rates fall as to how the funds fare better as a result.

While  Value Research recognizes 486 debt funds as on the day, when it comes to 19 different sub types, the total goes to 577, the discrepency of 91 more seems to be stemming from the fact that certain funds are double counted across the sub types, which does not hurt our analysis. But, like to report this anamoly though.

2. The individual investors rarely leverage debt funds. It is usually for very high net worth individuals and institutions to leverage for fixed income.  The individual investors find it easy to participate in bonds by investing in hybrid funds which is a various mix of equity and bonds.

The following types of debt funds can be found:


Liquid Funds :


Ideal for short-term investments with high liquidity. They invest in very short-term debt instruments, 

with portfolio maturity of less than 91 days. A good alternative to savings bank account; potential to offer higher post-tax returns.

Income Funds :


These funds are suited for regular income and invest in a mix of government and corporate securities.


Ultra Short-Term Funds :


Aimed at investors with a short-term horizon, these funds invest in debt instruments with shorter maturities. 

Ulta Short Term bonds are Low duration funds, with portfolio maturity of less than a year. Ideal for parking short-term surplus money; also offer slightly better returns than liquid funds.

Short-Term Funds: Medium duration funds where portfolio maturity ranges from one year – three years. Investors with a horizon greater than one year can benefit from these funds in a rising interest rate scenario
.
Long Term Funds:  Medium to long duration funds with portfolio maturity between three and 10 years. Suitable for investors with a longer investment horizon. These funds benefit when interest rates fall as bond prices (NAVs) and interest rates are inversely correlated.

Gilt Funds :


These invest primarily in government securities and are considered low-risk. 

Medium to long duration funds with portfolio maturity between three and 20 years and negligible credit risk 

Dynamic Bond Funds :


Managed actively to adapt to the changing market conditions,  by reducing the portfolio maturity in a rising interest rate environment and increasing portfolio maturity in a falling interest rate environment. They have the potential to offer higher returns. 

Ideal for investors who may find it difficult to judge the interest rate movement. These funds help investors minimize interest rate risk as they offer flexibility to alter the portfolio maturity according to the interest rate scenario. Maturity is longer when interest rates fall and shorter when interest rates rise.

Credit Opportunity Funds :


Invest in debt instruments with varying credit qualities, potentially providing higher returns with higher risk.

These funds purchase bonds in lower rated bonds to generate higher returns/yields. Suitable only for investors with a profile to take higher risk as investing down the rating spectrum adds to the risk of the portfolio
.

Fixed Maturity Plans (FMPs) :


Close ended funds with a fixed maturity date, providing a clear investment horizon. Passively managed. 

An alternative to FDs with investment horizon of over three years.

Corporate Bond Funds :


Potentially offering higher returns than government securities


Monthly income Plans (MIPs): Medium to long duration funds normally with exposure of less than 30% to equity. Ideal for investors who are looking for returns better than traditional debt instruments and do not want higher exposure to equities. The tilt towards debt ensures stability of income and the equity portion provides appreciation when stock markets rise.

Capital Protection Oriented Funds (CPFs):  Follow an investment structure which seeks to protect the initial investment from capital erosion. These type of scheme offered is “oriented towards protection of capital” and “not with guaranteed returns”. The orientation towards protection of the capital originates from the portfolio structure of the scheme and not from any bank guarantee, insurance cover etc. CPFs have a small equity component which gives risk-averse investors an opportunity to participate in the equity markets without worrying about erosion of the principal which is protected. CPFs are also rated by credit rating agencies.

Floating Rate Funds (FRF): FRFs are a variant of income funds with the primary aim of minimising the volatility of investment returns that is usually associated with an income fund. FRFs invest primarily in instruments that offer floating interest rates. Floating rate securities are generally linked to the Mumbai Inter-Bank Offer Rate (MIBOR), i.e., the benchmark rate for debt instruments. The interest rate is reset periodically based on the interest rate movement. The objective of FRFs is to offer steady returns to investors in line with the prevailing market interest rates.

Overnight Funds: These funds invest in securities having a maturity of 1 day, typically money market instruments. These funds aim to provide liquidity and convenience, rather than high returns. They are suitable for investors (mainly corporate treasuries) looking to park funds for a very short period.

Low-Low Duration Funds: These funds are moderately risky and provide reasonable returns. They are useful for those looking to invest for around 6 months to one year. Their portfolio may include bonds with a weaker credit rating to kick up yields.

Short-Duration Funds: These funds invest in a judicious combination of short and long-term debt, as well as across credit ratings. These funds are recommended for investment horizons of 1-3 years. They usually earn higher returns than liquid and ultra-short duration funds but also show more NAV fluctuations.

Money Market Funds: These funds invest in debt instruments with a maturity of up to one year. They aim to generate returns from interest income, while their slightly longer duration offers some scope for capital gains.

Credit Risk Funds: These funds invest a minimum of 65% of total assets in corporate bonds rated AA or below. That is why they usually generate higher yields as compared to the more conservative corporate bond funds. Investors who are willing to take on higher default risk may consider investing in credit-risk funds.

Banking and PSU Funds: These funds invest at least 80% of total assets in debt instruments issued by banks, PSUs, and public financial institutions. This is a moderate-risk product that seeks to balance yield, safety, and liquidity.

3. In the summary table above, the overall average return of all the debt funds are given for the timeline 1W thru 1Y, and the same is given by 19 debt fund subtypes. Where the sub type fund returns is equal or better than the overall in a timeline, such return is marked in green, else in red.

4. The sub-type funds returns are sorted by the overall ranking, based on the rank average across the return ranks from 1W thru 1Y. The return ranking of each sub-type is marked in the right side for each time line too.

5. Debt Funds Performance Summary by Sub Type

 In each sub-type funds table below, if the number of funds are more than 50, only the top 50 based on monthly return are shown. All tables sorted by reducing monthly return. The rows in green are those with above average return in all timelines from 1M thru 1Y. The rows in amber are the ones with above average return in timelines 1M thru 1Y except for one timeline.

5.1. Long Duration Debt Funds

5.2. Dynamic Bond Debt Funds


5.3. Gilt Debt Funds


5.4. Others (US Treasury Bonds)


5.5. Gilt with 10 Year Constant Duration


5.6. Medium to Long Duration


5.7. Floater


5.8. Target Maturity


5.9 Medium Duration


5.10 Credit Risk


5.11. Corporate Bond

5.12. Banking & PSU
5.13. Short Duration


5.14 Low Duration


5.15. Money Market


5.16. Ultra Short Duration

5.17. Liquid


5.18. Fixed Maturity
5.19. Overnight

Disclaimer:

- This is not a solicitation for mutual fund investment nor an advice. It is only an insight to help investment decisions based on the free MF performance data downloaded from Value Research. Investment decisions are only yours to make.

- Mutual fund investments are subjected to market risk. Read the propsectus of a mutual fund for all the risk information associated prior to investment.

- The author can not be responsible for the ommissions or errors in the data from Value Research or the data processing errors if any by the author.

- All your investment decisions need to be based on your decision finally, with no blame to anyone else later.


Sunday, August 25, 2024

Top 50 mutual funds analysis as on Aug 23, 2024


Commentary:

1. All mutual fund types had good recovery for the last week. As a result, all mutual fund averages for the month is positive.

2. Top 50 equity funds monthly return rose to 8.26%. Top 50 equity funds annual return is at 72.99.


3. Looking at the Monthly Top 50 equity funds, the one in the green are those with above average return in all timelines from 1M thru 1Y. The one in amber are those with above average return in all timelines from 1M thru 1Y except for one time line.

4. While healthcare funds still lead, two small cap funds made it to the green.


5. The purpose of Monthly Bottom 50 equity funds is to sense the bearish reversal. This is done by highlighting above average annual returns in the list and below average returns for the week and month in Bold Red. Those having above average annual return in the list, but having below average return for the week or the month are marked in Bold Red. Per this, PSU Banks and the US market related funds are concern.


6. Very few funds have made it to the green and amber status in the top annual 50 equity funds list above.

7. The purpose of the Annual Bottom 50 funds list is to look for bullish reversal of underperforming funds which no way is a signal for fresh investment. This is done by highlighting abvoe average weekly and monthly returns in Bold. The annual return is made inconsequential for this analysis going forward. The funds with above average weekly return or monthly return are highlighted in Bold. Sad that Nifty Bank ETFs are outside this recovery list still.


8. The Top 50 hybrid funds for the month and year both are given above with applicable green and amber status above.


9. The Monthly Top list of coomodity funds above has only one fund in green status.

Disclaimer:

- This is not a solicitation for mutual fund investment nor an advice. It is only an insight to help investment decisions based on the free MF performance data downloaded from Value Research. Investment decisions are only yours to make.

- Mutual fund investments are subjected to market risk. Read the propsectus of a mutual fund for all the risk information associated prior to investment.

- The author can not be responsible for the ommissions or errors in the data from Value Research or the data processing errors if any by the author.

- All your investment decisions need to be based on your decision finally, with no blame to anyone else later.

Saturday, August 17, 2024

Special MF Report - Detailed Hybrid Funds Returns Analysis by Sub Fund Type as on Aug 16, 2024


Commentary:

1. This special MF report is taken once a month. It is to track Hybrid Funds performance by all the subtypes.

There are different types of hybrid funds with different risk appetite. While aggressive, multi asset allocation, and dynamic asset allocation fund types have maximum equity exposure, the balanced hybrid funds have moderate, and the rest which are hybrid conservative, hybrid equity savings types have much lesser equity exposure. The Hybrid Arbitrage type has the lowest equity exposure, and is considered for returning slightly higher return than debt funds.  The returns of hybrid funds reduce as the equity exposure reduces, which you can check in the average return by fund type above.

2. Please refer to the earlier such report at:

https://natsfuncorner.blogspot.com/2024/06/specialmf-report-top-hybrid-funds-by.html

3. Looking at the performance summary by sub type: Hybrid Agressive MF is on the top of the list, followed by Balanced Hybrid MF followed by Dynamic Asset Allocation and Multi Asset Allocation.

4. The bottom three fund types are the conservative ones, Conservative Hybrid followed by Equity Savings followed by Hybrid Arbitrage at the bottom.

5. One can notice that thru the recent equity correction phase, the Hybrid Aggressive followed by Multi Asset Allocation types performed sub par in the last one month. Correction in the commodity (Gold and Sliver) was also the reason for the Multi Asset sub par performance.

6. One would use different types of hybrid funds depending on one's risk reward appetite. However, in the last few years, hybrid fund is unable to supecede equity fund performance as such a bearish sentiment has not yet come on equities in these years.

7. In the detailed performance analysis discussions below, by sub type, the color green or amber does not mean automatic investment recommendation. It simply means which funds stand out by consistent performance, that is all. The one on the green are those with above average return in all timelines 1M thru 1Y, and the one in Amber are also the same except missing above average return for one timeline alone.

8. Performance by sub type

8.1. Aggressive Hybrid:


8.2. Balanced Hybrid:


8.3. Dynamic Asset Allocation:


8.4. Multi-Asset Allocaiton


8.5. Conservative Hybrid

8.6. Equity Savings


8.7. Arbitrage


Disclaimer:

- This is not a solicitation for mutual fund investment nor an advice. It is only an insight to help investment decisions based on the free MF performance data downloaded from Value Research. Investment decisions are only yours to make.

- Mutual fund investments are subjected to market risk. Read the propsectus of a mutual fund for all the risk information associated prior to investment.

- The author can not be responsible for the ommissions or errors in the data from Value Research or the data processing errors if any by the author.

- All your investment decisions need to be based on your decision finally, with no blame to anyone else later.


Friday, August 16, 2024

Top 50 Mutual Funds Analysis as on Aug 16, 2024


Commentary:

1. All Mutual Fund Types turned positive for the week on average.

2. Equity and Commodity funds gave negative return on average. The debt and hybrid funds on average were positive for the month.

3. The average of Top 50 Equity Funds for the Month was at low of 5.62. But, the annual average of all equity funds came back to above 40%. Average annual return of Top 50 equity funds is at 71.92% which is kind of low.

4. Looking at the Equity Monthly Top 50, the one in the green are those with above average return in all timelines from 1M thru 1Y. The one in the amber are those with above average return in all timelines from 1M thru 1Y except for one timeline. Monthly Top 50 list is dominated by healthcare and technology funds.


5. The purpose on Monthly Bottom 50 is to identify bearish reversals, which is done by highlighting above average annual returns (In Black Bold) and below average returns on weekly or monthly basis (Marked in Bold Red). The funds meeting this criteria are marked in Bold Red. Notable ones are HDFC Defence Fund, certain PSU Bank ETFs, certain Infrastructure funds etc.


6. Looking at the Annual Top 50, a few ones made it to the green or amber, for having substandard returns from 1W or 1M basis. Bandhan small cap fund made it to the green and stayed positive for both the 1W and 1M basis.


7. The puroose of the Annual Bottom 50 list is to look for bullish reversal, for which above average annual return, monthly return and weekly return are highlighted. Funds with above average annual return and also above average monthly or weekly return are highlighted with Bold. No noteworthy mentions here. However, many Bank ETFs are still stuck here with no bullish reversal sign like last week. So, the bad time continues.


8. By looking at Hybrid Top 50 for both the month and year, one can make investment decisions based on green and amber status.


9. Looking at the Commodity Monthly Top list, this week recovery has helped to move certain funds to the green status.

Disclaimer:

- This is not a solicitation for mutual fund investment nor an advice. It is only an insight to help investment decisions based on the free MF performance data downloaded from Value Research. Investment decisions are only yours to make.

- Mutual fund investments are subjected to market risk. Read the propsectus of a mutual fund for all the risk information associated prior to investment.

- The author can not be responsible for the ommissions or errors in the data from Value Research or the data processing errors if any by the author.

- All your investment decisions need to be based on your decision finally, with no blame to anyone else later.