Saturday, August 17, 2024

Special MF Report - Detailed Hybrid Funds Returns Analysis by Sub Fund Type as on Aug 16, 2024


Commentary:

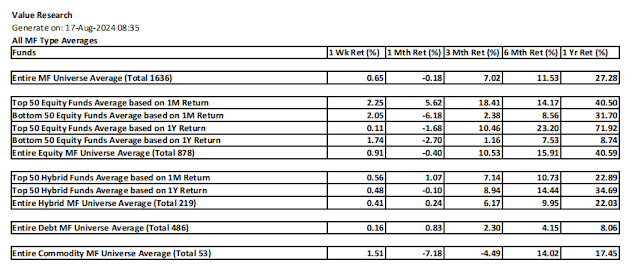
1. This special MF report is taken once a month. It is to track Hybrid Funds performance by all the subtypes.

There are different types of hybrid funds with different risk appetite. While aggressive, multi asset allocation, and dynamic asset allocation fund types have maximum equity exposure, the balanced hybrid funds have moderate, and the rest which are hybrid conservative, hybrid equity savings types have much lesser equity exposure. The Hybrid Arbitrage type has the lowest equity exposure, and is considered for returning slightly higher return than debt funds.  The returns of hybrid funds reduce as the equity exposure reduces, which you can check in the average return by fund type above.

2. Please refer to the earlier such report at:

https://natsfuncorner.blogspot.com/2024/06/specialmf-report-top-hybrid-funds-by.html

3. Looking at the performance summary by sub type: Hybrid Agressive MF is on the top of the list, followed by Balanced Hybrid MF followed by Dynamic Asset Allocation and Multi Asset Allocation.

4. The bottom three fund types are the conservative ones, Conservative Hybrid followed by Equity Savings followed by Hybrid Arbitrage at the bottom.

5. One can notice that thru the recent equity correction phase, the Hybrid Aggressive followed by Multi Asset Allocation types performed sub par in the last one month. Correction in the commodity (Gold and Sliver) was also the reason for the Multi Asset sub par performance.

6. One would use different types of hybrid funds depending on one's risk reward appetite. However, in the last few years, hybrid fund is unable to supecede equity fund performance as such a bearish sentiment has not yet come on equities in these years.

7. In the detailed performance analysis discussions below, by sub type, the color green or amber does not mean automatic investment recommendation. It simply means which funds stand out by consistent performance, that is all. The one on the green are those with above average return in all timelines 1M thru 1Y, and the one in Amber are also the same except missing above average return for one timeline alone.

8. Performance by sub type

8.1. Aggressive Hybrid:


8.2. Balanced Hybrid:


8.3. Dynamic Asset Allocation:


8.4. Multi-Asset Allocaiton


8.5. Conservative Hybrid

8.6. Equity Savings


8.7. Arbitrage


Disclaimer:

- This is not a solicitation for mutual fund investment nor an advice. It is only an insight to help investment decisions based on the free MF performance data downloaded from Value Research. Investment decisions are only yours to make.

- Mutual fund investments are subjected to market risk. Read the propsectus of a mutual fund for all the risk information associated prior to investment.

- The author can not be responsible for the ommissions or errors in the data from Value Research or the data processing errors if any by the author.

- All your investment decisions need to be based on your decision finally, with no blame to anyone else later.


Friday, August 16, 2024

Top 50 Mutual Funds Analysis as on Aug 16, 2024


Commentary:

1. All Mutual Fund Types turned positive for the week on average.

2. Equity and Commodity funds gave negative return on average. The debt and hybrid funds on average were positive for the month.

3. The average of Top 50 Equity Funds for the Month was at low of 5.62. But, the annual average of all equity funds came back to above 40%. Average annual return of Top 50 equity funds is at 71.92% which is kind of low.

4. Looking at the Equity Monthly Top 50, the one in the green are those with above average return in all timelines from 1M thru 1Y. The one in the amber are those with above average return in all timelines from 1M thru 1Y except for one timeline. Monthly Top 50 list is dominated by healthcare and technology funds.


5. The purpose on Monthly Bottom 50 is to identify bearish reversals, which is done by highlighting above average annual returns (In Black Bold) and below average returns on weekly or monthly basis (Marked in Bold Red). The funds meeting this criteria are marked in Bold Red. Notable ones are HDFC Defence Fund, certain PSU Bank ETFs, certain Infrastructure funds etc.


6. Looking at the Annual Top 50, a few ones made it to the green or amber, for having substandard returns from 1W or 1M basis. Bandhan small cap fund made it to the green and stayed positive for both the 1W and 1M basis.


7. The puroose of the Annual Bottom 50 list is to look for bullish reversal, for which above average annual return, monthly return and weekly return are highlighted. Funds with above average annual return and also above average monthly or weekly return are highlighted with Bold. No noteworthy mentions here. However, many Bank ETFs are still stuck here with no bullish reversal sign like last week. So, the bad time continues.


8. By looking at Hybrid Top 50 for both the month and year, one can make investment decisions based on green and amber status.


9. Looking at the Commodity Monthly Top list, this week recovery has helped to move certain funds to the green status.

Disclaimer:

- This is not a solicitation for mutual fund investment nor an advice. It is only an insight to help investment decisions based on the free MF performance data downloaded from Value Research. Investment decisions are only yours to make.

- Mutual fund investments are subjected to market risk. Read the propsectus of a mutual fund for all the risk information associated prior to investment.

- The author can not be responsible for the ommissions or errors in the data from Value Research or the data processing errors if any by the author.

- All your investment decisions need to be based on your decision finally, with no blame to anyone else later.


Saturday, August 10, 2024

Special MF Report - Detailed Equity Funds Returns Analysis by Sub Types - As on Aug 9, 2024


Commentary:

1. Commitment is to generate a detailed Equity Mutual Fund Returns analysis by monthly, with performance comparisons across Equity Fund Sub Types.

2. There are 20 equity mutual fund sub types. Their average return is given for all the timelines from 1W thru 1Y. Their relative performance rank is also given by timeline. Then at the end, overall ranking is given based on the ranking average from 1W thru 1Y.

3. The fund sub types are sorted in descending order of overall relative performance across all the timelines. The fund types at the top are the most favorite, and the one in the bottom are the least favorites as on today.

4. Top 5 fund types in descending order of overall returns are:

   a. Pharma

   b. Consumption

   c. PSU

  d. Mid Cap

  e. Multi Cap

5. Bottom 5 fund types in descending order of overall returns are:

  a. Large Cap

  b. Flexi Cap

  c. MNC

  d. Banking

  e. International  (The worst fund type)

6. Average equity fund returns across all the 871 funds are computed and marked in Amber. Within each fund type, the superior return to this average are marked in green and sub par performance is marked as Red.

7. For each fund sub type, the performance rank is marked across all the timelines, with rank number color coded.

8. Refer to an earlier month detailed report for changes since last one month or so, as to the performance and rankings.  Please note a minor difference between these two reports which is that this report has the funds sorted by monthly performance, where as the earlier report with link below is sorted by 6M performance.

https://natsfuncorner.blogspot.com/2024/07/special-mutual-funds-report-last-6.html

 9. The performance report by sub type follows. Look for 20 such reports below.

Please note down a key distinction which is that the green coded funds are those with above average returns across all timelines, but they do not mean investment worthiness as much they are meant in the usual top 50 funds analysis. The one in the amber are those funds with above average returns in all timelines except for one. 

9.1. Pharma


9.2. Consumption


9.3. PSU


9.4. Mid Cap


9.5. Multi Cap


9.6. Energy


9.7. ESG


9.8. Dividend Yield


9.9. Infrastructure


9.10. Large & Mid Cap


9.11. Small Cap


9.12. Thematic General


9.13. Value Oriented


9.14. Technology


9.15. ELSS


9.16. Large Cap


9.17. Flexi Cap


9.18. MNC


9.19. Banking


9.20. International


Disclaimer:

- This is not a solicitation for mutual fund investment nor an advice. It is only an insight to help investment decisions based on the free MF performance data downloaded from Value Research. Investment decisions are only yours to make.

- Mutual fund investments are subjected to market risk. Read the propsectus of a mutual fund for all the risk information associated prior to investment.

- The author can not be responsible for the ommissions or errors in the data from Value Research or the data processing errors if any by the author.

- All your investment decisions need to be based on your decision finally, with no blame to anyone else later.

Friday, August 9, 2024

Top 50 Mutual Funds Analysis as on Aug 9, 2024


Commentary:

1. All mutual fund types except for debt funds corrected for the week. Both commodity and equity funds corrected for the month on average.

2. Annual Top 50 return is now reduced to 69.92%.annually Monthly Top 50 return is now reduced to 6.06% monthly. Annual Hybrid return of top 50 is now reduced to 33.32% annually. Monthly Hybrid Top 50 return is now reduced to 1.07% monthly.

3. There is room to invest freshly based on Top 50 funds selectively.


4. Looking at the Monthly Top 50 funds list, the one in the green are those with above average return in all timelines from 1M thru 1Y. The one in the amber are those missing above average return in only one timeline across 1M thru 1Y.

5. Pharma/Healthcare funds dominate the Monthly Top 50 list. Some FMCG/Consume and IT/Tech funds too can be found here.


6. Purpose of the Monthly Bottom 50 funds list is to appreciate the bearish reversal of some bullish equity funds. The above average annual return is bolded within the list, and below average monthly and weekly return are highlighted with Red Bold. The funds with below average weekly or monthly return and above average annual return are highlighted with Bold Red. Among these, most notable is the HDFC Defence fund, which continues its bearish reversal.US Equity based funds are also in bearish reversal. The bearish reversal is a clue to sell the fund and protect the profit so far, even at the risk of short term capital gain. eg. Those who entered HDFC Defence fund at the top annual return of 147% are now staring at significant correction, bringing this annual return to 102% level. So, those who sold on first bearish reversal are smiling.


7. Looking at the Annual Top 50 equity list, only two funds made it to the green status, there are many in amber. I am personally fascinated to start investing in Bandhan Small Cap fund, as when the going gets tough, the tough gets going.


8. Purpose of Annual Bottom 50 list is to appreciate the bullish reversal of underperforming funds. It does not mean that they are investment worthy. The bullish reversal is identified with those having above average return either in weekly or monthly column, and also on annual column. Noteworthy ones are the bunch of Bank ETFs with confirmed bullish reversal. The worst seems to be over for these funds.


9. With equity correction, we should expect some leadership churn out in the Hybrid Monthly Top 50. The one in the green are those with above average return from 1M thru 1Y timelines. The one in Amber are those with missing above average return in 1 timeline only across 1M thru 1Y.

10. The equity correction has allowed entry of some balanced advantage funds into this list, which  otherwise wont make the list due to less aggressive returns. 


11. When it comes to Hybrid Annual Top 50, the leadership names are similar to usual. It is interesting to note that the DSP Equity & Bond Fund popped into Amber in both the monthly and annual top 50 list.


12. Commodity funds paint a sad story with correction both on weekly and monthly basis. No fund could get the green status. There are bunch in Amber.

Disclaimer:

- This is not a solicitation for mutual fund investment nor an advice. It is only an insight to help investment decisions based on the free MF performance data downloaded from Value Research. Investment decisions are only yours to make.

- Mutual fund investments are subjected to market risk. Read the propsectus of a mutual fund for all the risk information associated prior to investment.

- The author can not be responsible for the ommissions or errors in the data from Value Research or the data processing errors if any by the author.

- All your investment decisions need to be based on your decision finally, with no blame to anyone else later.

Friday, August 2, 2024

Monthly Top 50 mutual funds analysis as on Aug 2, 2024


Commentary:

1. Mutual funds, on average had a positive week for all fund types and a positive month except for the commodities. Equity Monthly Top 50 average returns is subdued to 9.2%.  Equity Annual Top 50 average was subdued to 74.29%. However, the equity MF universe average return prevailed at an impressive 41.34% annually while the monthly average was bit subdued at 2.63%. What this tells is that equity mutual funds returns on average is discelerating.


2. Looking at the Equity Monthly Top 50, the pharma / healthcare funds are ruling the list. Some FMCG, Tech, and PSU funds are also in the list. The one in the green are those with above average returns in all timelines from 1M thru 1Y, those with Amber color are those with above average return in all timelines from 1M thru 1Y except for one timeline. It is prudent to invest in pharma funds now, especially for those who are short term investors in mutual funds. The pharma funds are the Beta funds when the market takes a breather from bull run, and they can quickly go out of fashion when the bull run returns. The lower annual returns of the pharma funds indicate the same. But, the pharma funds may do well thru next one or two months.


3. We look at the Monthly Bottom 50 funds list to identify the potential bearish reversals of some funds. For this we look for the annual return to be above average (marked in Bold Black) and the monthly or weekly returns below average (Marked in Bold Red). The fudns meeting this criteria are marked in Bold Red.  The worthy ones to note here are the HDFC Defence Fund, UTI BSE Housing Index Fund, ICICI Prudential Commodities Fund, Mirae Asset NYSE FANG+ ETF. Related fund categories need to be viewed with suspecion for further corrections ahead.


4. Looking at the Equity Annual Top 50 list above, the one in the green are those with above average returns in all timelines from 1M thru 1Y, and the one in Amber are those with above average returns in all timelines from 1M thru 1Y except for one timeline.


5. We look at the Equity Annual Bottom 50 funds for the bullish reversal of underperforming funds. (The Title Equity Bottom Top 50 should be read as Equity Annual Bottom 50). The potential bullish reversal candidates are marked in bold for having an above average return in Weekly or Monthly timelines and also the above average return in the Annual timeline. Sad news is that the bunch of Nifty Bank ETF funds at the bottom of the list are yet to show the bullish reversal sign, ideally they should not have been in this list. But for being in this list, they should have had a bullish reversal sign, which they do not have, which means they will continue to drift with sub par performance ahead.


6. In both the Hybrid Monthly Top 50, and the Hybrid Annual Top 50 lists above the green and amber lines are marked for the funds per the same critieria as explained in the equity funds.


7. Looking at the Monthly Top list of Commodity funds, none of the funds made it to the green status and only one made it to the Amber status. There is clearly a leadership divergence across different timelines causing this anamoly. Because the Commodty funds had a good week of bullish reversal, may be it is safer now to reenter them for an annual average return of 10% for the short term.

Disclaimer:

- This is not a solicitation for mutual fund investment nor an advice. It is only an insight to help investment decisions based on the free MF performance data downloaded from Value Research. Investment decisions are only yours to make.

- Mutual fund investments are subjected to market risk. Read the propsectus of a mutual fund for all the risk information associated prior to investment.

- The author can not be responsible for the ommissions or errors in the data from Value Research or the data processing errors if any by the author.

- All your investment decisions need to be based on your decision finally, with no blame to anyone else later.