Friday, March 29, 2024

Top Funds with best 1Y return through the financial year 2024


Commentary:

1. Value Research considers timeline till 1Y as short term, and the rest beyond as Long Term. I personally consider 1Y timeline as a medium term timeline in between short term and long term.

Therefore, for me 1Y performance benchmark are very important as a bridge between short term game and long term game. I am new to mutual fund investments (just 9 months since I started) and I am not yet ready to give more weightage to the performances beyond 1Y, as my portfolio being small, I like to limit the time horizon to last 1Y performance max for now.

2.  Incidentally, the Top 50 performers across all fund types are equity only, hence there seems to be a sense of repetion across all types top 50 and equity only top 50. This trend will continue till the bull market remains strong for the equities. The recent correction has failed to erode the 1Y performance benchmarks of equity funds in favor of hybrid funds. Since such a trend did not pop up through the current short term correction, I am not counting on such a phenomenon to happen short term through the rest of the calendar year, unless there can be a significant correction of equity in parallel with significant interest rate cuts.

3. When it comes to the equity funds investments, I will be waiting for the revival of them in the monthly top 50, and when that happens, this annual leaders list also becomes useful on my fresh investment decisions. Also, rationalizing the absence of some top annual leaders in the monthly leaders ahead will indicate the nature of churn and recovery of equity market. For example, we do not see much of pure large cap funds in the top annual 50 now, but they might start appearing as favorable as the large caps have been doing well through the recent broader market correction phase.

4. If the gap between the pure equity and hybrid funds start narrowing, then hybrid funds investments will also become attractive, the 1Y top 50 given here, will become handy along with the monthly performance leaders as they appear in the top 50.

5. For me personally, it is either debt fund or commodity fund as a replacement to the bank FD. I found out that some of the leading bond funds are not available for the individual investment, for example DSP Credit Risk Fund which is in the top 50. I will continue to invest in leading commodity funds for now till the trend of debt funds beat them due to interest rate cuts ahead.

6. Please read this blog along with the previous blog, which is 1M performance leaders related blog coinciding this cut off date of March 29, 2024 which is a weekend, month end and financial year end simultaneously.  Some insights shared in the commentary of the previous blog is not repeated here, but relevant to assess the 1Y performance of mutual funds in general.


Top and Bottom 50 funds based on last 1M performance as on March 29, 2024


Commentary:

1. This report is primarily useful to evaluate the monthly trend on a weekly basis. As this weekend also coincides with the financial year end 2024, the averages for both 1M and 1Y are given in all the report segments. Also, the top 50 are given for each of the fund types based on 1M Return.

2. Anticipate a separate blog for detailed annual performance analysis of all fund types, similar to the 1M performance analysis here.

3. When you look at the 1M Top 50, other than a few foreign equity based funds and one special fund at the end, most of the performance leaders are the commodity funds.

4. When it comes to fresh investment decisions, our benchmark is that the funds need to have better than top 50 average performance across all timelines from 1M thru 1Y. From this perspective, funds making the cut are shown in green. Please note that these funds are commodity funds. So, green signal is not yet there to resume investment into equity or hybrid funds based on superior 1M performance.

5. Also, the returns which are better than the top 50 average are marked in bold.

6. Please note that the 6M and 1Y return averages for Top 50 are worse than that of Bottom 50, and even all funds average, because the top 50 based on 1M performance are driven by commodity funds which tend to give lower returns annually when compared to equity or hybrid. Once the current broad based correction gets over, such an anamoly will disapper as the equity and hybrid funds will start making it to top 50 based on 1M return.

7. Please note that the Top 50 funds based on 1Y performance have given an average return of 74.52% even after the recent correction. This kind of return is phenomenal. Also, note the bottom 50, even after suffering recent correction, have given a whopping 40.16% annual return.  

Therefore, one should assess the end of correction of equity (proven by equity and hybrid funds making it to monthly top 50), and resume the investment into equity funds. It is assumed that those who believe in systemic investment plan will anyway invest into equity even through the correction phase. (I personally prefer to invest into equity funds again at the bottom of correction phase, which I anticipate will be by April end).

8. When one looks at the average annual return of all mutual funds across all types (of course more dominated by equity funds), even after the recent ongoing correction of broader market, it is still a healthy 27.62%.   Also, one can see that all equity funds annual return average is 42.26%. So, it is fair to say that a mutual fund investor should have made a minimum annual return of somewhere in between 27.62% and 42.26%, which is approximately 35% annual return for the financial year 2024. If your mutual fund portfolio did not give that kind of a return, you need to look critically as to scope for improvement in your portfolio management and investment decisioning.

9. One month return of pure equity funds have improved significantly thru this week, thanks to the recovery of equity through this week. The recovery is seen thru foreign equity funds, auto, manufacturing, transportation and logistics  based funds, and some other themes like ELSS, Midcap etc. But the absence of Large Cap and Small Cap can be noted in top equity 50, as the recovery of the same is not much when compared to the correction gone in. 

10. Even the hybrid funds return for the year varied from 22.34% to 34.64%, leading to an average of approx. 28%. This is very impressive return even after the recent corrections of the broader market.

11. As usual, we do not see much variance in debt funds returns, the range is from 7.75 to 9.53, the average of which is slightly better than the bank FD returns. The golder period of debt funds is anticipated, but has not yet arrived, which will happen when interest rates start falling, likely to happen in second half of 2024 calendar year.

12. What is spectacular among commodity funds is the 1M level return. If this kind of return continues in coming months, then the returns on 3M, 6M and 1Y level also will keep improving. I still suggest commodity funds investments as a replacement to the bank FDs as hybrid funds are better bets against risks of equity funds on continued corrections.

13. Looking at the bottom 50 funds across all types based on 1M return, they are lead by IT, Smallcap, Microcap, BFSI, Teck etc. It is sad to see that some flexi cap funds are still in bottom 50.

14. I personally will consider making some more fresh investments into some of the commodity funds marked green, more as a replacement to FD investments.  My pause of investments into equity and hybrid still continues, as my strategy is not to invest thru correction but to invest with vengiance into equity and hybrid post confirmation of correction end, which I am anticipating by April end earliest. If the 4th Q results surprise suprelative to anticipation, this can be earlier than April end. Let us see.

15. This analysis is mainly done for my benefit, no harm in sharing with some additional work if it benefits the reader, but this is never a ploy of investment advice to anyone, this is more of a disclaimer.
 

Equity Top 50 based on 1M Return


Hybrid Top 50 based on 1M Return:

Debt Top 50 Funds based on 1M Return:


Commodity Top 50 based on 1M Return:


Friday, March 22, 2024

Top 50 and Bottom 50 Funds based on 1M performance as on March 23 2024


Commentary:

1. From this issue onwards, Top 50 is distinguished not only for the entire MF universe (aaprox 1500 plus), but also for each fund category i.e. equity, hybrid, debt and commodity. Comparisons of averages across various tables give further insight as to what is happening in the market fron the MF investments perspective.

2. Looking at Top 50 funds across all types, the average performance is ahead in all timelines except for the 1Y period. What this means is that the correction on equity funds has been effective enough to take the shine on performance till 6M timeline. But, when we compare the averages of bottom 50 funds against the funds universe average, bottom 50 funds still rule in 6M and 1Y category, because the bottom 50 are filled with the best performers of the earlier bull period.

3. Looking at the top 50, the investment worthiness which is to have higher returns than Top 50 average in all the timelines from 1M thru 1Y, the international equity investments make it to the criteria, and none of the domestic equity based funds.  Other than the international equity based funds, it is mostly the commodity funds who make it to the top 50.

4. Looking at the bottom 50, though these funds are laggards on 1M performance, many of them have shown nice recovery through the last 1W, but not enough to erase the losses thru the rest of the 1M. So, if recovery continues like the two sessions in this week, we may find some of these funds from the bottom 50 to spring out of bottom 50, if not to the Top 50.  We need to see, what kind of funds will make it to top 50 in such a case, will it be hybrid funds, flexicap funds, speciality funds etc.

5. Comparing the top 50 across debt and commodity funds, commodity funds are showing better performance in almost all timelines.

6. Among the hybrid funds, Top 50 are still underperformers against the rest of hybrid funds in the 3M, 6M and 1Y timelines. What this means is that the traditional leaders among hybrid funds have corrected recently more than the rest in the category, which means the multi asset aspect or the arbitrage aspect has not worked much wonder so far against the correction.

7. Bottom 50 is filled with most of the IT funds in addition to small cap and microcap funds.

8. Market behavior thru next week could give more clarity ahead, whether the equity and hybrid funds will continue to correct or not, vs. will there be recovery Vs. will the commodity funds remain attractive for short term.

9. Personally I have withdrawn 70% of my mutual fund investments through this week at the risk of short term capital gains tax and exit loads.  This is because, personally I like to protect my capital short term till the market bullishness around equity is reestablished, which could be within next 15-60 days, and then I will have funds to re-enter with vangience.  I am anticipating some recovery through the rest of the March, which could be given away again in April due to Fourth Quarter result disappointments. I could be wrong here, but one needs to take a stand at the risk of being wrong.  I also made fresh investments into Gold Funds, (SBI and Axis). 


Saturday, March 16, 2024

Top 50 and Bottom 50 mutual funds based on last 1M Return across all types of funds - As on March 16, 2024


Commentary:

1. Big take away this time is that market direction has confirmed reversal as to the bullishness of equity funds. The commodity funds are ruling the top 50, except for one speciality fund focused on Europe offshore.

2. Therefore, there is no need for me to do over-analysis to figure out the funds that have fallen from top 50 when compared to 28 days prior.  So the report looks simple.  

Instead I have introduced two more information

    - A separate bottom 50 funds report based on last one month return.
    - Average return of all mutual funds (Approx. 1559 this time) across timelines.

- May be I can give the average return of all mutual funds by mutual fund category, from next week. This is something I noticed now, it is too late to go back and do the further donkey work.

3. One can see that the 3M, 6M, and 1Y average of Top 50 funds is lower than that of entire MF universe across all types of funds. This is because majority of funds are either equity or hybrid, and they still have a sizable return in these timelines when compared to the commodity funds in the top 50, whose returns across these timelines will be slightly better than the fixed deposits.

4. Another key observation is that either the debt funds or the hybrid funds have not made into the top 50 list. This is because commodity funds are way ahead of them in 1M performance.  

5. As per the current trend, one can park excess money in top performing commodity funds, for returns superior than fixed deposits.

6. We do not know as to how long and how deep this bearishness will cast on equity funds. May be, equity funds will pop in top 50 after one or two weeks, or not.

7. We get one more chance of Top 50 and Bottom 50 report before this financial year ends for any liquidation of existing mutual fund investments for tax purposes. I am not making any recommendation as to such decisions as I may not be qualified for the same, and also it depends on one's investment strategy. For example, one committed to the Systemic Investment Plan will continue to make regular payments and get more units for those payments due to reduced NAV of such funds.

8. But I am very clear as to my investment approach. Looking at the bottom 50 funds report, the smallcap and microcap are way too underpeforming, and it is unlikely that they will see a reversal soon, and if there is any reversal, then we can see so in the weekly analysis ahead. Since I have next 15 days to liquidate some of my existing MF investments for FY 2024 tax adjustments, I am going to liquidate all pure play small cap and micro cap funds fully, because I will keep this money in the sideline to reenter when they start popping up in the top 50 performance again. Also, given the financial year end and no projection of quick revival of smallcap and microcap, many people like me going for liquidation can create a run on the bank condition on such funds, so we may find worse performance of these funds through next two weeks before things become better for them.  Again, this is not what I am asking you to do, as a disclaimer.

Friday, March 8, 2024

Top 50 Mutual Funds based on 1M Return as on March 8, 2024


Commentary:

1. Market is correcting on midcap and smallcap, certain large caps are taking the top benchmark indices to new level. So, we can expect major churn out in the top 50. Since the commodities like Gold and Silver are doing well, commodity funds have popped up into top 50, but they should be considered as a replacement for FD and not equity. Hybrid and debt funds dint make it to top 50 funds list yet.

2. The weekly list of top 50 funds is useful for the fresh investments. Since, the average of top 50 funds across different timelines is given at the bottom, one should consider consistent performance across all timelines, which is basically having the return higher than top 50 averages across all the timelines. Such funds are bolded this time. 

They are as follows:

- DSP Nifty PSU Bank ETF

- HDFC Nifty PSU Bank ETF

- ICICI Prudential Nifty PSU Bank ETF

- Kotak Nifty PSU Bank ETF

- Nippon India ETF Nifty PSU Bank BeES

- CPSE ETF.

3. If one wants to compromise on below average of top 50 returns on 1w or 1M levels, a dozen more funds look reasonable, even in the list of funds going out of top 50. For example, Quant Large & Midcap Fund came short on 1M return, but has good 1W return, so it may be a candidate to consider, else, if large cap rally continues, it might make it to top 50 next week.

4. Since Gold and Silver are in the up move, one can start considering such funds as a replacement for FD. In such case, I find Axis Gold ETF having better returns across all timelines, beating FD returns.

5. As guessed last week, Quant Fund family is getting impacted with the latest market dynamics in the sense that not a single fund made it to top 50 this time. 

6. The various averages at the end are very useful to summarise the market action, across lat 1 week, and last 28 days.  As one can see that average returns are fading across all timelines, when compared to last week.

7. With market dynamics being very volatile now a days, this weekly report based on top 1M return is becoming more and more useful for fresh investment considerations and to readjust Mutual fund return expectations based on new market dynamics.

8. I am bit disappointed that certain hybrid funds could not make to the top 50 list. This is becasue, the aggressive equity portion in such funds were impacted by the midcap and smallcap corrections, so much so that other thematic funds did better to come into top 50.

9. As the market dynamics change, new funds are being launched with new themes. Some of such funds keep popping up in top 50, but with no 6M and 1Y track record. One can take risk on such funds too. For example, ICICI Prudential Nifty PSU Bank ETF does not have a track record beyond 6M returns, but all the returns upto 6M timeline are good, so can be considered, hence, I have already included in my list of investment elegibilities by making the fund name bold.

10. Remember, for your monthly investments, you get to see this kind of weekly report four times, so you can stagger your monthly fresh investments across four weekly reports.  Last week, Quant Infrastructure Fund made it to the eligibility by having above average returns in all the timelines, but it has fallen from the top 50 this week, with below average returns both on 1M and 1W timelines, but it does not mean that investment made last week was a mistake. It might return to top 50 in weeks ahead or it might not. So, focus every week is about new investment focus, and not to second guess on prior investments. 

11. For myself, the performance target benchmark is half of the top fund return for 1Y. In this report it is CPSE ETF which has given 106%, half of which is 53%. But the top 50 average 1Y return this week is 49.55, which means that there is a risk of not achieving my previously set benchmark, if the market volatility continues. In such case, I will settle for 70% of top 50 average = 70%.49.55 = 35% for now.  Please note that the benchmarks will keep changing as market dynamics shape up week to week.


Friday, March 1, 2024

Top 50 Indian Mutual Funds based on 1M Return as on March 1, 2024


Commentary:

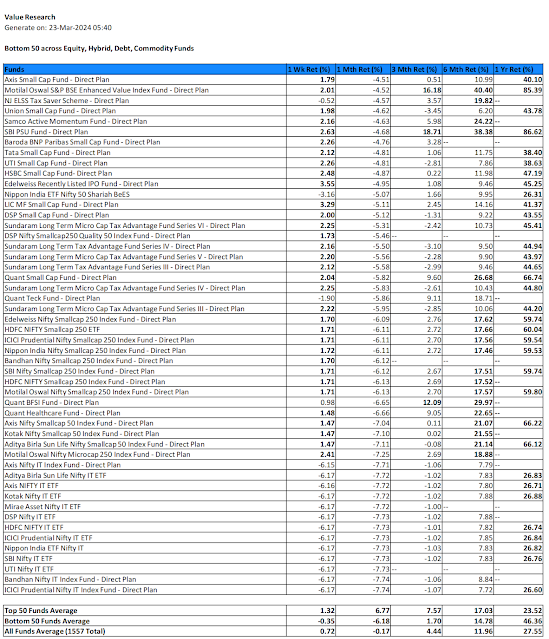
1. How this table is useful? 

By focusing on the top 50 funds based on last 1M return, it is possible to identify consistent performers across all the timelines till 1Y, which are more suitable for fresh investments, as they are keeping up with the market dynamics.

The funds that were in top 50 as on 28 days back, but not any more are marked in Red at the end. In this, one would still see consistent performers, but with 1M Return lower than the top 50 through this period. It is possible that some of these will return to Top 50 again ahead.

The concept here is that, by sticking to consistent performers across all the timelines from 1W thru 1Y for fresh investments, it is possible that our investment returns in the portfolio will be better than average, as we will be doing far more justice against the trap of "past performance is not an indication of future performance".  By ensuring consistent performance across all timelines till 1Y, we will minimize falling into the trap of one time darlings, who otherwise underperform after initial shining.  For example, the very first row in this report, Mirae Asset Hang Seng TECH ETF is a way underperformer for 3M, 6M, 1Y timelines, hence wont make it to our investment decisions in spite of greater performance thru 1M and 1W time periods.

Since this report is produced on a weekly basis, one gets four chances to hang on to the consistent performers, so a good fund missing for a week, can re appear ahead, and be considered again for fresh investments.

So the game here is to improve the portfolio level return at least to the 50% of the return of top performing fund. In this report, top 1Y performing fund has given 106%, so our self esteem needs to be tuned to expect 53% return thru market dynamics ahead, which can not be guaranteed, but the portfolio management attention will improve. Beyond this report, one needs to make Hold and Sell decisions, again these dynamic benchmarks will help there too. 

For example, if the 1Y benchmark is 53%, I may still hold on to a fund which has given only 25% through the year, but may sell of a fund which has only 15% return, even at the risk of additional 5% taxation, as I may be confident to achieve more than 20% return with the freed up money thru fresh investments ahead based on anticipated market dynamics. 

So, when it comes to the portfolio management, the benchmarks for Sell decisions need to have far more tolerance, and need to account for potential corrections and taxation, and ability of the underperforming fund to withstand such corrections too.

At the portfolio management level, Hold decisions are the easiest, as one needs to do nothing.

But, one significant change here is that we hope to cling on to the top performers among consistent performers, and hence increase our portfolio returns than passive SIP investments to a fund which had a past glory and has not done well recently.  The counter to this could be that a Momentum based buy decision could lead to significant correction ahead, but by ensuring consistent performance across multiple timelines, we minimize this risk.

2. Key further refinements through this week report:

 - Since market has become volatile, though the focus is 1M return, 1W return column is reintroduced, in order to assess whether the past glory of performance is already waning through last 1W, or the new heroes are emerging in the 1M list based on the potential last 1W flash in the pan peformance.

- Since the market is volatile, the arrogance of looking at only the equity and hybrid funds is now mended to include all types of funds. What this means is that if the debt and commodity funds are in a position to beat equity and hybrid funds in 1M performance, they will pop up in the list going forward.

- The top 50 average returns for various timelines for this period reporting will serve as the minimum benchmark, instead of my own heuristic judgemental benchamaks. These averages are shown at the end. This way, I do not have the burden to tweak my own judgemental benchmarks as the market dynamics change ahead.

-The top 50 average returns for various timelines 28 days back are also shown. This way, we can appreciate how these benchmarks are changing to higher or lower based on market dynamics.

- The two averages that are marked in grey at the end, are the 1M return averages 28 days back, first one is 28 days back to March 1, and second one is 28 days back to Feb 3.

3. Since market is being volatile and may lead to significant correction ahead through March, for fresh investments, I have decided to make the criteria bit more stringent, which is that the returns in all timelines including the 1W window need to be higher than or equal to the top 50 average.  Such returns are marked in Bold. As per this criteria, this week, I would consider only the Quant Infrastructure Fund for fresh investments.

Further observations:

4. This analysis is based on Value Research dat download. It has become clear that Value Research data can be erroneous, maily due to omission of certain funds. For example, the funds with no 1M return as on 28 days back are the ones missing in the report then. Similarly, the some of the funds falling off the top 50 are missing this time in the Value Research data, hence are not being shown here.

5. Though March 2 Saturday is a trading day, decision is to include that data as part of the next week report. This is different treatment than last time around, where the Saturday data was included for the same week. Decision to keep the weekly boundaries to Friday going forward.

6. You may notice that the 6M and 1Y average of top 50 funds as on 28 days back were way lower than the ones in this period. 14.23 Vs 33.45 for 6M, 28.89 Vs. 59.19 for 1Y. What this means is that in the report 28 days back, too many funds with lower returns for 6M and 1Y popped into Top 50, and better consistent performers through 6M and 1Y period have returned thru this report. One may notice that though there has been a considerable correction through this week, the averages of top 50 for different timelines are still healthy.  So, we can now observe how the market dynamics alter our own consistent performance benchmarks for investment decisions.  This is a good point to be included in the report such that on corrections, we may get negative returns as average, and we can assess the departure of these averages from the ideal averages when the market was hot in the past. 

7. You may also notice that Quant family has fallen from the grace of having highest number of funds in the Top 50. It is ICICI Prudential this time with 6, followed by Mirae and Nippon with 5 each. Quant has only 4. What this may indicate is that Quant funds may be underpeformers when the market turns corrective. Need further validation though.