Saturday, February 24, 2024

Debt & Commodity Funds Returns Analysis across different short and long term time lines


 Commentary:

1. Debt funds are meant to give returns slightly higher than the Fixed Deposits. Debt funds can have higher risk than fixed deposits, and tend to give superior returns when the interest rates are falling. Debt funds return are primarily depending on interest of debt instruments, but the face value of a debt instrument can fall when interest rates are going up. Therefore, it is possible that a debt fund can also give a negative return through such periods.

2. Debt funds had a taxation advantage till March 2023, as indexation benefit was available. With that removed, the taxation benefits are gone, debt fund incomes are taxed at par with Fixed Deposits, as part of income.

3. For this analysis, both the debt funds and commodity funds are included, which are not included for the equity funds analysis.

4. Since, there is an expectation that prime interest rates are likely to fall from June 2024, there will be some interest in debt funds in coming months, to beat the returns of fixed deposits. So, some money may flow from fixed deposits to debt funds. Hence this analysis as a baseline before the debt fund attractiveness goes up in couple of months ahead.

5. For an equity investor, there is an opportunity to ride on debt instruments through hybrid funds. These hybrid funds can be aggressive on equity, conservative on equity, or can use balanced or of multi-asset approach. Hybrid funds are always included in my equity funds analysis. I would believe that only when the hybrid funds start beating the performance of pure equity funds, it is time for us to wake up to the reality of debt funds to leverage. When there is a correction in equity market causing negative return on mutual funds, the hybrid funds and debt funds will start looking attractive.

6. Therefore, with the tax savings advantage gone, one could say that debt funds can be considered to replace FDs when they become more attractive than FDs, and hybrid funds to replace pure equity mutual funds when the market starts correcting leading to negative returns on pure equity mutual funds.

7. There is inherent risk in debt instruments, and this risk is reflected through the credit rating of the instrument. But, this risk is managed overall at the mutual fund level. Therefore, it is always better to choose a debt mutual fund than a singular debt instrument like NCD etc. to manage the risk better.

8. Credit Risk Fund are a type of debt fund, where the focus is to invest on high risk debt instruments, leading to better returns as the interest rate associated are very high. Here, the strategy is to manage the high risk across the portfolio level, and ensure better returns than the usual debt funds. Typically, this works well when the economy and market are upwards, but when shit hits the fan, such funds can give massive negative returns. Since India market has been doing well since last three years, one particular credit risk fund has given more than 40% annualized return on a 3 year basis, which is amazing, but still pales against equity fund returns, given the level of risks are similar.

9. Personally, I have ensured my life style through FDs, and enjoying an average of 8% interest rate on them, hence I have ignored the debt funds so far, focusing purely on equity funds for MF investments. But, imagine that FD interest rates could be falling to 6% in future, and the debt funds giving superior 10% return, even I will be jumping into debt funds mode.

10. When it comes to the risk of pure equity funds risks, where the fund returns become negative on huge market corrections, my strategy is to shift to hybrid funds for fresh investments, as they will be popping on the top of the table in my weekly mutual funds analysis. I did this debt fund analysis for one time now, for me to get a grip of historic realities and a baseline benchamark before interest rates start falling in coming months.

11. Fair to say, that keep reading my weekly mutual fund analysis report, as it gives a good mirror to equity market dynamics, and your fresh investments are automatically adjusted to the new market realities, whether up or down.

12. Will consider a monthly debt & commodity funds analysis as they become attractive for fresh investments. If Gold invest becomes attractive, it will pop up in this monthly report as commodity funds to are included.

---------------------------

Top returns of Debt and Commodity Funds, both short term and long term

A. Short Term 

Section1 - 1 Week Return


Section 2 - 1M Return


Section 3: 3M Return


Section 4: 6M Return

Section 5: 1Y Retrun


Part II - Long Term Returns

Section 6: 3Y Return

Section 7: 5Y Return

Section 8: 10Y Return

Section 9: 15Y and 20Y Return


Mutual Fund Returns Analysis across different short and long term time lines - Useful to enhance our perspectives on mutual fund investments both short and long term!


Commentary:

This is an attempt to view top performing mutual funds based on different time lines.  All the data is from Value Research, and only the equity and hybrid funds are considered here.

Value research gives mutual fund data in two perspectives, short term and long term. It does not give the perspectives with both the short terms and long terms together. For value research, short term is presented in terms of 1W, 1M, 3M, 6M and 1Y. Long term is represented in terms of 3Y, 5Y, 10Y, 15Y and 20Y.

Ideally, I could have merged all timelines into different columns in one sheet, but that required combining two sheets using VLOOKUP. Since I use free office software and it does not give me that function, I have done this presentation this way, for my convenience.

If you have patience to combine the short term and long term perspectives into one single sheet, you can download the data from Value Research from these links, while downloading you need to select all Equity Funds once, and all Hybrid funds next, so you need to combine two worksheets once in each of Short Term and Long Term category, and then you need to integrate the two resulting worksheets at column level using VLOOKUP function.

Data source:

https://www.valueresearchonline.com/funds/selector/primary-category/1/equity/?plan-type=direct&tab=returns-short-term

Here, one needs to switch between Short Term and Long Term buttons given at the row where download to Excel option is given, and make separate excel down loads across two timelines.

The mutual fund returns have become far more attractive in India since the last three years. Therefore, we can see funds with 3Y return as high as 52.58%. As we move the time window farther, the return percentage reduces, for two reasons. One is that both the market and the funds were not evolved like now a days. Second is that mutual fund performances tend to saturate over time like the index returns. Typically, index based mutual funds tend to follow the index level returns with 1 to 2% overhead due to expense ratio.  Also, we can see that as the time line is stretched far before, number of available mutual funds also dwindle. Also, here, we do not know the history of Indian mutual funds beyond Value Research boot strap, still we have 20 years performance data in this report.

Those who have been in the market for more than two decades are very much accustomed to 15-20% long term returns as healthy for mutual funds. Folks like me who are new to the fund investments, are very much spoiled by the recent top returns of mutual funds, and demand very high annual returns for the current market conditions.  While the old tigers are conditioned not to aim for more than 15 - 20% annual returns, we the new bees are aiming for 60% annual returns while such previlege lasts at least.

Here, I have used the following cut off benchmarks for the top performing funds by timeline:

    1W : >= 2.5% return

    1M : >= 10% return

    3M : >= 20% return

    6M : >= 35% return

    1Y : >= 60% return

    3Y : >= 30% return

    5Y: >= 25% return

    10Y: >= 20% return

    15Y : No benchmark, very few in the list

    20Y : No benchmark, very few in the list

Take a ride with different timelines, and give a bow to the top performers for each timeline. Also, note down the long standing high performers of yester years, and how the mutual fund market has expanded significantly through the last one decade.  The competition for top rankings will only go up further from here.

To put things in further perspective, I have quickly calculated nifty returns for the similar timelines by fetching approximate nifty levels from the charts over different timelines as follows:


Based on these levels, I have calculated nifty returns, and compared with highest return from a top fund for the same timeline, and a typical MF return at portfolio level at half of top fund return. Take a look:


My analysis on this:

1. Top performing mutual fund is way ahead of nifty returns for short term, but it starts falling closer to nifty returns for longer timelines. I have ignored 15Y and 20Y timelines for mutual funds as the mutual fund market then was not mature. 

2. What is an useful practical benchmark for our portfolio returns is in the last column, which is half of top performing fund return. This is some what close to the intuitive  benchmarks I have used for marking top funds in the report below. 

3. One insight going forward is that Indian stock market and therefore mutual fund market have been maturing considerably through last few years. Also, there is a good chance that the long term returns from India could be far better than they were 10 years before. Therefore, there is a need for the investors to adjust the self esteem and expectations higher into the future, and upgrade the expectations beyond the historic benchmarks, and set it somewhere in between what they were and whatever sizzling level resulted through the last three years.

4. Bottom line, through this analysis, I am further convinced that it is not crazy to aim typical 45% annual return from our mutual fund portfolio as per the current market dynamics. We need to adjust this expectation level if the dynamics cools off ahead.  Rest is the discipline of execution and portfolio management.

Browse the rest of the blog, and take whaever insight or inspiration you like to take with you for further steps.

Best wishes

Nataraja Upadhya


----------------------------------------------------------

Part A: Short Term - 1Y, 6M, 3M, 1M, 1W

Section 1: Top Funds based on higher return over 1 Year; Return >= 60%


Section 2: Top funds based on top return over last six months; Return >= 35%


Section 3: Top funds based on top return over last three months; Return >= 20%


Section 4: Top funds based on top return over last one month Return >= 10%


Section 5: Top Funds based on high 1 Week return i.e. >=2.5%


Part II: Long Term

Section 6: Top funds based on top return over last 3 years; Return >= 30%


Section 7: Top funds based on top return over last 5 years; Return >= 25%


Section 8: Top funds based on top return over last 10 years; Return >= 20%


Section 9: Top funds based on top return over last 15 years; 


Section 10: Top funds based on top return over last 20 years; 


Friday, February 23, 2024

Top 50 funds based on last one month return as on Feb 24 2024


Commentary:

1. The average 1M return of top 50 funds is 13.58%, which was 11.65% last week, which means that top 50 funds doing better than last one week.

The average 1M return of the same top fifty funds 28 days back were 6.08%, which means these funds accumulated accelerating gains thru last 28 days.

The average 1M return of top 50 funds as on Jan 27, which is 28 days back was 7.7%, again, confirming that riding on top 50 funds does give glimpse of better performers based on last one month return for the current market conditions. If the top 50 funds average based on 1M returns is an index like Nifty 50, the mutual funds at this index level are still doing great, the bull run is still on, though there is a churn out in the top 50 list.

2. When it comes to new investment decisions, it is recommended that one looks for consistent top performance across different time lines from 1M through 1Y, the top performers are highlighted in bold, based on the following benchmark which is 1Y Return >= 60%, 6M Return >=35%, 3M Return >=20%, and 1M Return in Top 50.

3. This list should be used mainly for buying new investments, not for hold and sell decisions. 

4. The rows in red are the funds which were in top 50 28 days back, but have fallen off the top 50 list as on this week. Here too, one may see consistent performers except for the 1M return. One needs to weight whether the 1M return for these will improve, or further erode through coming weeks, so definitely these funds deserve Hold, if not fresh Buy. Even Fresh Buy can be considered if there is faith that they will make it to top 50 again ahead based on anticipated market dynamics ahead.

5. Theory here is that, by focusing on top 50 funds with consistent top returns for all time lines upto 1Y, one gets to ride on the most recent bull trend of the funds, which will help to enhance the investment returns for the fresh investments as the trend tends to continue till it stops. So, if the benchmark here for top 1Y return is 60%, and one is happy with 30% annual return for MF investments in general for the current market dynamics, this approach for fresh investments may enhance the portfolio level return from 30% to 45% very likely.

6. Whem it comes to Sell decisions on low performing funds, the performance benchmarks used here are useful for evaluation. Further one needs to take judgement call as to whether hold a fund beyond 1 Year to save capital gain and Exit load overheads. (One will pay short term gain of 15% for holding for less than one year, and pay long term gain of 10% only for holding more than one year. This 5% difference and the exit load burden of upto 2% is a consideration for selling under performing funds before one year completion.)

7. One can see some trends in the top fifty as follows:

- PSU Bank Funds have come back in to vougue. PSU Funds are still attractive.

- One large cap fund has made it back to top 50, and it is from the Quant family. Bravo! But, it is still an under performer against 6M and 1Y performance benchmarks.

- Certain pharma, healthcare, power and infra funds have fallen from top 50.

- Quant family has improved its hegemony in top 50 funds list thru this week, there are 12 among top 50. Of course, there is a churn out as to which are these 12 funds.

- The second top fund house here is ICICI Prudential, 6 funds in top 50.

8. CPSE ETF regains top spot for 1Y return, which 110% and triggering tears, tears of joy for those riding on it, and tears of lost opportunity for those missing on it. Interestingly, this is a quirk of Value Research, as this is more of an ETF than a mutual fund, if you want to invest in it. So, you will need a demat account to pursue this ETF.

110% annual return is the bearer of the flag for India continuing to shine in the markets, even through the MF path.

Mera Bhaarath Mahaan!

 9. Again I challenge positional traders to beat the 1Y return benchmark of 60%, and the short term traders to beat the annual return benchmark of 100%, if there is underperformance in your portfolio against these benchmarks, please consider yielding to mutual funds path to save you agony and time!

10. Standard disclaimers apply. Past pefromance is no guarantee for the performance ahead. But, in mutual funds arena, consistent performance across various timelines is a good bet to have.


Best regards,

Nataraja Upadhya


Monday, February 19, 2024

Evolution of NU Intra Day and Swing Trading Philosophy - Work In Progress (forever may be)


Image couresy:

https://money.howstuffworks.com/personal-finance/online-banking/online-trading.htm


Prelude:


This is personal notes towards evolving an effective philosophy of trading for self, but a reader can benefit from this, while the caveats in this philosophy can hurt him or her too.  Once the philosophy is addressed comprehensively, I will develop the NU Trading Commandments or Rules for the same, which too will be published as being evolved.

This philosophy is being evolved through a series of meditations and jotting down of inspired insights as a random collection of points to note. Hence, there can be gaps and overlaps in the resulting notes.

When we take up a journey of learning and transformation, our state of being becomes varied from point to point in journey. It can go through various stages like beginner luck, innocence of virgin mind, opening to risks of unknown, perils of half knowledge, excitement of monkey using a hammer for everything as it has got only one tool to use and is so excited about using the tool resulting in overusage, a level of saturation and apathy etc.  Therefore, these notes may be refined by revisiting.

Therefore, any reader is advised not to stick to this philosophy per se, rather take inspirations and insights to develop a personal philosophy for the same.

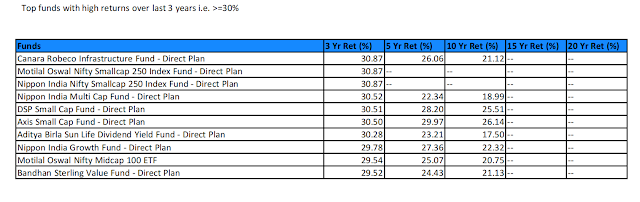
I personally have prioritized the journey of mastering intraday and swing trading at the cost of ignoring positional trading. This is because I see lot of synnergy between intraday and swing trading, and the dynamics associated are already full time engagement for me. For me, loss of not doing positional trading is being compensated by a series of swing trading and / or intraday trading.  However, as a risk management measure, I invest in mutual funds in leu of positional trading for now. I will eventually get into positional trading, once I am convinced of achieving higher returns than this trading. Even then, I will keep the philosophy of positional trading separate from this philosophy, at least until I can integrate the philosophies associated into a wholesome one.

The salient features of this evolving philosophy is discussed a series of points of insights, combining packets of knowledge, observation, analysis and synthesis.

Once I complete this journey, which is documentation of comprehensive philosophy followed by time tested set of trading principles or manifesto, I will be ready to train others or coach.  Then, these notes become very handy like a lecture notes of a new lecturer is used over next two three decades till retirement.


Evolving NU Intraday and Swing Trading:

1. Trading is like a fishing engagement. It needs a calm mind and soaring of the heart. It needs to be meditative while it can be exciting or sad one too. It is also like a solo dance or a martial art session. It needs some amount of preparation before taking the stage, and it needs some unwinding to do, after the session.  There needs to be synnergy and harmony with the rest of life style too, as this activity is one small segment of life and living.

2. There needs to be clarity of purpose, objectives, strategy, plan and execution management followed by regular reviews towards mastery of the craft towards optimization of objectives.   This aspect needs to be harmonized with the same at the life and living level too.

2. The purpose can be the amassing optimal amount of wealth over time, with optimization of efforts, fun, pain, and associated other sacrifices or adjustments.

3. The objectives under the clarity of purpose can be as follows: I am noting it directly in terms of success benchmarks.

    - Return on engagement in terms of 

            - Money made

            - Fun had

            - Minimization of Exertion, effort, attention, homework, health loss etc. 

            - Sacrifices or adjustments of living made

            - Minimization of risk, losses including notional, opportunity losses, inactivity losses etc.

            - Optimization of theory, practice, dancing across dynamics into an artful expression that elevates through repetitive engagements

4. To optimize the objectives, the following metrics need to be understood, measured, and constant care needs to be there towards improvement and mastery:

    - Optimal demand on margin investments

    - Optimal return over time on margin investments

    - Optimal write offs on bad trades, both in terms of percentage of write off per time, and frequency of write offs

   - Percentage of being right vs. wrong, in terms of trade entry, trade exit. It is not just about being right from the perspective of returns, it is also about timing of entry, and quality of the trade script among choices available. There may need to be sacrifices made, one may exit a current profitable or loss trade to increase the returns over time for  a better opportunity that surfaces.  Since, trading context can be very dynamic like surfing, portfolio management discipline and principles do matter, will be discussed separately.

- Optimal balance between risk and reward, which again is dynamic. One can not plan for Black Swan events of the market, but there needs to be a level of dynamism to spot them as they appear. One can not be too greedy due to increase of risks and one can not be too fearful leading to loss of optimal opportunities.

- The core character of intraday and swing trading is leverage of momentum, momentum of the market and scripts associated. In surfing terms, the overall condition of the ocean is like market conditions, individual waves to ride on are the scripts. Then there is a question of how to get on to these waves, when to get on, when to get out, and how to harmonize getting off into a getting into a new big fun wave. 

- Therefore, minimization of idle magins for risk and reward optimization also is a consideration. 

- On a good market day, one can be like a drunken monkey, go around hitting everything with a simple tool like hammer and still be successful. On a bad market day, one needs to be far more meditative and be happy with smaller fishes caught in singular counts. So, the engagement approach too is very dynamic, one can not approach with a rigid rule. Market conditions can change within a day, in terms of 15 minutes window. So, the approach needs to be dynamic from a drunken monkey to a meditating saint.

5. Who I am shapes what I choose to do, and what I do shape who I am. Therefore, people signing up for trading expedition need to be fluid in living. So, I am now approaching the psychology aspects, transformation aspects and price to pay through trading engagements.

- Trading is not for all. First of all, there needs to be a level of acceptance and self esteem in trading. This is possible only if the philosophy of one's life is aligned with the realities of trading.

- Trading is not for proud people, proud of being, proud of doing, proud of achieving, and proud of making a difference. They have much better opportunities for the same.

-Trading is not for fearful people. This is too much unnecessary trauma to go through for such people.

- Trading is also not for greedy people. They can do better robbing a bank elsewhere.

- Trading is well suited for people like me, philosophical, lazy, observant, analytical, amoral (above right and wrong than being insensitive to it), able to experience zen among chaos and multi level dynamics, enjoying a complex dance where there are no rules but you are willing to make your own rules and can enjoy solo dance with no partner, one who can enjoy the solitude, can balance the self expression across what is out there Vs. what one wants to unleash with and open to the results whichever they may turn out to be.

- Therefore, the funny thing about trading is that while the objectives could be optimization of returns including the money aspect, it is a journey of transcendence across uncertainities, half knowledge, risks, rewards, surprises, serendipity and some times pitiable dead market conditions. One who is comfortable to balance sanity with insanity will do better in trading.

- So, one may get into the journey of trading with a narrow objective or open drifting life style. But, once on this bandwagon, series of transformations will hit the individual with no mercy. Therefore, people dedicated to one particular vision or objective in life should avoid trading.  Trading is the best avenue for the lost souls like me, who enjoy drifting, eternally happy in a student mode than being an achiever, an observant philosopher, or outright jobless and purposeless in life. Trading is a huge distraction for the one with other significant purpose in life. Trading could be a fruitful distraction like someone taking a fishing expedition through the weekend, but I am ignoring this aspect for now, as the transformaitonal price to pay could be much larger than the returns of temporary distraction desired.  So, this trading expedition is like going into a dark rabbit hole, being ready to face whatever thing appears through the journey.

The corollary also is true, which is that trading can fit anyone aligned to it, and can afford to commit to it.  Growing up, I liked listening to classical music, but was very clear that I will not dedicate myself to learn it. Only way I said I will dedicate to it, is that if I am imprisoned and have nothing else to do in life. Similarly, one who wonders what to do in life and has not many options possible, can consider trading as a profession, especially those who are stuck at home for various reasons. Since I am entering the retirement phase of life, my health may gradually wane, I made concious decison to keep rest of my life online and of mental engagement with no excuse of dependency on others for my retirement engagement. Trading fit me very well, I can do it till my eyes and mental acumen do not give up. Also, I had enough life experiences with a sense of completion, and trading fit me as one of the best avenues for optimal returns of time, energy and passion.

6. Once being a successful trader, one can have mutliple other overlapping life purposes and engagements, but trading needs to be at the center of it. Trading requires a full time alignment if not engagement to market hours, it may need some amount of preparatory home work and winding down routines, so it can be an intense ten hour engagement on a working day. So, it needs to be embraced as a profession and not a on and off hobby. The rest of the life needs to be realigned to this profession. Like a doctor who will refuse to do surgery on the road side, a trader needs to minimize engagement if a day requires presence elsewhere. But, a doctor is trained to do the needful when a crisis occurs in a remote location with no aids. Similarly a trader can engage in minimal trading away from the market, and this is a separate discussion later.  The possibilities for a trader, in life out side trading, is also a relevant subject to discuss, but will be dealt at later stage.

7. Trading requires a stage set up like setting a stage for a dance recital.  This of course includes optimal account features, use of lap top and a smart phone simultaneously, access to instantaneous fundamental and technical analysis, quick validations through trading rules for buy, hold and sell decisions, parallel background work for margin management, risk management, portfolio optimization etc. Since trading requires a series of cycles of opportunity hunting or alerts, evaluation of opportunities, entry and exits, management through opportunities, revisit of opportunities engaged before or dropped, set up of the laptop across these dynamics is important. Optimal utilization of resources across computer speed and memory, same of the remote servers for the same, hopping across screens etc. are part of the dance. A small delay in trading decision or execution can have an impact. (Certain trades need to be market mode for speed, some need to be on limit mode for better returns).

8. Whether one trades at home, or home office, or elsewhere, distractions are part of the game, some distractions are voluntary and some are involuntary. An execution discipline through the market hours does matter in this regard. Typically for an Indian Market, one can dedicate one to two hours of home work before market open, certain observations through the pre-market dynamics of 15 minutes before open, the excitement of market open dynamics that can last for 15-45 minutes, major market impacts at different time intervals, typical market lull during 11am /12 pm thru 2 pm, market excitement in the last one hour, and market players making certain bets for the next day, last 15 minutes of market death dynamics for the day etc. So, best time to take a long break is during 12 pm thru 2 pm. Even during this time frame, a particular opportunity may come and go. One needs to assess the value of time. For me, I may take a cooking break, but with something on the stove, I may steel five minutes away, make a profitable trade in that five minutes, and go back to cooking mode. This aspect is unique to intraday trading. Since momentum leverage is the game, one can get into and out of miniscule time trades, and such opportunities can be 10 such trades in an hour on a good market day, while nothing may happen on a dull market day. So, one needs to be dynamic on taking the breaks too. I may choose to be distracted with protracted lunch and a TV show during the lull hours on a dull market day, or skip cooking and eat some readily available food by the laptop minimizing only to toilet breaks on an excited market day.

This dynamics further complicates, if one chooses to play in multiple markets, not just the Indian market. One should not plan to work for more than 10 hours a day on such realities.

9. Upcoming

    - How many trades for the day

    - Trade size and life span

   - Margin management

   - Portfolio optimization

  - Risk Reward management

  - Health management of a trader

 - Many more topics...


Friday, February 16, 2024

Top 50 funds analysis based on last one month return as on Feb 17 2024


Top 50 funds analysis based on last one month top return as on Feb 17 2024:


1. The Top 50 average monthly return this time is 11.65%, bit less than that of week before, which was 12.61%, which is an indication of mutual funds returns slowing down due to broader market slow down.


2. The current Top 50 average monthly return as on Jan 20th, which was 28 days before is 4.93%, where as the similar return of top 50 as on Jan 20th was 6.89%, which indicates significant churn out in top 50 funds as on now, both in terms of funds coming in and going out of the list.  Similar numbers in last week report were 7.55% and 9.3%, which means there has been far more churn out in the top 50 list this week, when compared to last week report. As the broader market becomes volatile, the top 50 funds list also becomes volatile.


3. In order to make decisions for fresh investments, it is advised that one looks for consistent top performance across all timelines: 1M, 3M, 6M and 1Y. Such performances are highlighted with bold, so funds with all these columns bold are more favorable choices to invest.  This consideration helps to skip the momentary entries of some funds in the list this week due to market vagaries, which otherwise can return to suboptimal performances later.  Case in point are the rows marked red in the bottom, which are the funds falling out of top 50 list this time, but were in top 50 as on Jan 20th.  Here too, some consistent performers can be found, while some of them can be identified as nonconsistent performers. Consistent performers overall have better chances to return to top 50 list more often in this weekly analysis.


4. Typical benchmark used for consistent performance is as follows:

a) 1 Month - Being in top 50 list (lowest this time is 8.8% return)

b) 3 Month - 20% return

c) 6 Month - 35% return

d) 12 Month - 60% return

One can see that, even among top 50 funds, the top return benchmarks on higher timeline tend to be saturating as follows:


1m*12 = 105.6%

3m*4 = 80%

6m*2 = 70%

1Y = 60%


This is inline with what actually happens with all mutual funds, due to the non consistent returns of all constituting scripts in a fund and the associated churn out of scripts within a fund over time.


5. It is hoped that, by considering consistent performers within the most recent top 50 funds for the fresh MF investments, one can aim better than average annual return for the fresh investments, which can be anywhere between approx. 30%  minimum average for current market dynamics and the 60% 1Y return benchmark used here, and average of which is 45%. If the new MF investments can show better returns, then this effort is well worth.  Regression analysis for confirming the same is pending, and can be considered six months down the road.


There are good examples from the current top 50 funds list, which indirectly prove this point


CPSE Fund - 1Y return = 108.05%

Various PSU funds - 1Y return more than 90%


Thus, by reading between the lines across various weekly reports, this top 50 funds analysis helps to reconfirm the consistent top performances of certain fund types over certain period, and helps one to make adjustments as needed.  Typically, such variations in the last one year have been across small cap funds, mid cap funds, large and mid cap funds,flexi cap funds, value funds, sectoral funds like infrastructure, PSU, pharma, BFSI, IT. Also, certain fund house names shine better when such turns appear within fund types.


6. Quant fund house typically has more funds appearing in top 50 consistently, though such number this time has dwindled to 9 from 13 or so before. ICICI Prudential and Nippon tend to be throwing next best numbers in top 50 funds list consistently, though this time Motilal Oswal too has improved its count, after them.  This observation helps as to which fund house to choose across top performing fund types. However some exceptions apply, for example, when it comes to PSU fund, SBI PSU fund has been as much a darling like the ICICI Prudential.  This observation is more relevant for distributing new fund investments across different fund themes than putting into a same theme just because many appeared in top 50 list.


7. In summary, better returns can be expected by regularly investing on mutual funds, using both science and art, which tend to evolve and transform with the market dynamics.


8. Since I am hinting that one should aim 30-45% annual return from mutual fund investments (again, for current market dynamics which can change for better or worse mostly), it also means that one should stop playing with direct stock investments/trading if such a benchmark can not be beaten or one should look critically into the stock investment/trading game one has got going and catch up with the return benchmarks in their own game.


9. I have been investing in mutual funds for longer term game since last 7 months or so, and I do stock market trading for short term and intra day (Here my benchmark to beat is 200% annual return, 100% benchmark is being achieved so far, thanks to the favorable market dynamics than my talent). I am yet to start making long term stock investments as I am happy to stick to mutual funds for the same, as I am yet to develop the discipline of keeping the margins for longer term investments separate from that for short term and intra day trading. May be, after mastering my craft there, I will start long term stock investments towards beating the MF return benchmarks, much later. I tend to push the tax adjusted returns from my short term stock trading game into MF investments on a monthly basis, for which this top 50 funds analysis is quite useful. Thus, I am able to stop looking for external “tips” in all my investment and trading, rather use analysis and associated judgement call. While this weekly analysis suffices for MF investments of mine, a slew of regular fundamental and technical analysis is needed for any type of stocks trading, one should not even attempt stock trading without minimal mastery in both fundamental and technical analysis.


10. One can tap into all the noises around my analyses across MF and stock market trading at this whatsapp group (Other colleagues noises too will be here) :


https://chat.whatsapp.com/IuzkVAHgn1jJ20ZmB8m9Vz


11. One can expect a weekly separate blog on similar analysis every week, while it lasts.


Thank you,

Nataraja Upadhya


Wednesday, February 7, 2024

White Paper for beginner level traders!: NU Quantum BreakOuts


White Paper for beginner level traders!: NU Quantum BreakOuts -

 Exploitation of daily breakouts for superior returns for all types of traders, no need to be glued to the terminal!


What is NU Quantum Break Out?


NU Quantum BreakOut is a daily break out, which makes daily close distinctly higher than previous day and also higher than the most recent high close. This breakout can be a signal of new short term or long term breakout, or simply a finite opportunity for a day trader to exploit while it lasts.


Why it is called Quantum Breakout?


Here is a technique to deal with the break outs on a daily basis, in smaller segment, hence QUANTUM. Also, it is a catchy name to draw your attention to it.


Why it is NU?


NU is my name, Nataraja Upadhya. For the rest, it stands for New, new way of looking at daily breakouts.


What is the use of this breakout?


Typically this type of break out occurs either with larger candle body or with a significant gap after previous close, and with or without more than average volume.


A person glued to the terminal through the day can exploit these breakouts better, including the wickers, by exiting and entering multiple times through the day.


But a person who can not be in front of the terminal will miss the breakout opportunity. This technique allows him or her to exploit the script next day. Also, it allows the trader to remain focused on the personal style of trading, whether it is intra-day, swing, or positional.  The best thing about it is that it allows the trader to feed in orders in GTT mode and forget about it through the day, to do something else.


Principle context:


Sophisticated traders identify different types of breakout for swing trading or positional trading. It becomes bit difficult for all concerned to identify and exploit it at the genesis of it using advanced graphing. Also, some breakouts fizzle out, and waiting to be cautious about it, one could lose on some exceptional opportunities.  Further, this technique is easy for a beginner trader to follow and exploit for superior returns.


Idea is to catch a distinct breakout through today’s market, and make bettings for tommorrow accordingly.


How it works?


The breakout through today needs to establish higher close than yesterday. It also needs to be higher than the nearest top close if such a close is higher than previous day close.


The market offers at least 30-50 such NU Quantum Breakouts per day. So, there is no dearth for quality opportunities.


This technique is used to apply for the next day trading. So, the home work is to identify all the NU Quantum breakouts at the end of today.


One need to identify the following and validate the breakout.


1. Today’s close is higher than previous close.

2. Today’s close is higher than the most recent higher close, if it the most recent close is higher than previous close.


Once this breakout is validated, one will note the Today’s close level, and higher of the Previous Close or the most recent close being higher than Previous close, we will term this together as PrevHigh Close.


Now, for the Trader who can not be in front of the terminal, the trade logic works like this.


1. If you are already holding the script, you can place both the stop loss order and profit booking order optionally for tomorrow, using GTT.


The stop loss order is as follows:


- For the intra day trader, it is Today’s Close.

- For the swing trader, it is the PrevHigh Close.

- For the positional trader, it is the highest close after the highest close before the positional breakout started. If there is no highest close after the positional breakout, then it is the highest close before the positional breakout started.


For profit booking, one can use a logic approximately, as the anticipated tomorrow’s gain = Today’s Close + the difference between Today’s Close and PrevHigh Close.


The profit booking is usually desired by an intraday trader. The other two types of traders may like to skip, as the stop loss order is enough to manage the risks, unless they too are pressed for margins.


Please note this profit booking order is approximate, the order may not take place if that level is not achieved, or the script may zoom beyond this level.


If you do not hold the script yet, but like to play along tomorrow, then entry needs to be above Today Close. One should avoid entry below Today Close, as it may mean reversal of Today’s breakout. Once entered, the stop loss order and profit booking order will be relevant as discussed above.


Illustration using different examples:


1. Example 1: SAIL daily graph as on Feb 6, 2024.


a) Today’s close = 145.5

b) PrevHigh close = Prev Close = 137.15

c) Positional Prev High = the close of the first green candle which is raising above previous short term high. Previous short term high was approx on 01 Jan 2024, and close that day was 124.75.  The first green or red candle piercing this level was on Feb 02, with candle high of 128.


Therefore, the stop loss works this weay:


For the intra-day trader it is today’s close which is 145.5.

For the swing trader, it is the PrevHigh Close which is 137.5.

For the positional trader, it is the Positional PrevHigh which is 128.


Now, for those who like to place a profit booking order, it is the same for all types of traders.  The level is Today’s Close + Gain thru today which is the difference between today’s close and Prev High close, hence in this example it is 145.5+(145.5-137.15) = 145.5+8.35 = 153.85.


2. Example 2: INGERRAND chart on Feb 6, 2024


a) Today’s close = 3427.5

b) PrevHigh close = Top of third candle behind, which was red  = 3298.75

c) Positional Prev High = same as PrevHigh Close = 3298.75.


Therefore, the stop loss works this way:


For the intra-day trader it is today’s close which is 3427.5.

For the swing trader, it is the PrevHigh Close which is 3298.75.

For the positional trader, it is the Positional PrevHigh which too is 3298.75.


Now, for those who like to place a profit booking order, it is the same for all types of traders.  The profit booking level is Today’s Close + Gain thru today which is the difference between today’s close and Prev High close, hence in this example it is 3427.5+(3427.5-3298.5) = 3427.5+29 = 3456.5.


3. Example 3: Biocon Ltd on Feb 6, 2024


a) Today’s close = 298.65

b) PrevHigh close = Close on 8 Jan 2024 which is higher than prev close = 292.75

c) Positional Prev High = same as PrevHigh Close = 292.75.


Therefore, the stop loss works this way:


For the intra-day trader it is today’s close which is 298.65.

For the swing trader, it is the PrevHigh Close which is 292.75.

For the positional trader, it is the Positional PrevHigh which too is 292.75.


Now, for those who like to place a profit booking order, it is the same for all types of traders.  The profit booking level is Today’s Close + Gain thru today which is the difference between today’s close and Prev High close, hence in this example it is 298.65+(298.65-292.75) = 298.65+5.9= 304.55.


Please note that all NU Quantum Breakthru’s may not repeat for the next day, but it is likely if the short term breakthrough has some juice left still.  The shape of the candle (upper wick is negative, bottom wick is positive), volume and price action together today can indicate this possibility better.


One needs to know how to place both the Stop Loss and Limit Order for profit booking using GTT.


One disadvantage of placing GTT order is that one will not be able to dynamically exploit the possibilities of script behavior in real time. For example, if the scrpit has long wicks next day, one can buy and sell many times and expand the profits.


How to get ready for the market next day?


1. Look at the end of day heat map with both market cap and volume as size. Pick up the stocks above 3% daily return. Similarly pick up all the stocks with highest action for the day from various sources, which is either having higher than usual volume (say double) and having more than 1-2% gain.

2. Eliminate all the stocks which do not have their today’s close higher than previous close. Also, eliminate all the stocks which do not have today’s close higher than most recent high close.

3. For the selected ones, compute stop loss level and profit booking level.

4. Depending on margin, place GTT order for the stocks you like to bet offline.

5. Even if one is in front of the terminal, one can observe the chart of these selected ones and confirm whether the NU Quantum Breakout is continuing for the next day too, and exploit accordingly.

6. The one in front of the terminal next day, will catch the fresh break outs through the Heat Map (I use Trading View Heat Map. I set different timelines, and toggle between market cap and volume to get different breakouts in motion as well as accumulated through the day.)


Anticipate more such beginner friendly profit making trends blogs ahead.


Best wishes,

Nataraja Upadhya

nupadhya@gmail.com

+91 9632824391