
Important Note:
The format of this weekly report is further refined from this week, to create more value for the reader. The separate reports for Hybrid, Debt and Commodity funds are being discontinued, instead these fund types are combined with equity funds to create "Combined Top 50" for weekly, monthly and annual timelines. This way, we can look at the top 50 funds across all fund types, which help us to appreciate other fund types competing with equity fund types in market domination, that way the reader can be less partial only to only the equity funds I have been so far.
Since Gold and Silver prices are likely to explode ahead, we will therefore see the domination of commodity funds in the Combined Top 50 in near future. Also, there is one exceptional behavior of debt fund, which has shattered the results beyond equity funds, unable to confirm whether that is data error or an exceptional bond behavior.
The focus on equity funds will remain with detailed Top 50 and Bottom 50 analysis for weekly, monthly and annual basis. The bottom 50 for weekly and monthly will highlight bearish reversal signs within equity and the annual bottom 50 will highlight bullish reversal as usual.
1. Combined Funds Top 50
All the 1800+ funds from all fund types are tabulated to identify Top 50 ones for the week, month and year.
1.1. Combined Funds Top 50 Summary
Since India is just coming out war like situation with Pakistan, and the fourth quarter results season is tapering, global cues are also being volatile, there is no consistency of leadership in Combined Top 50 reports except for the Commodity funds. I personally have addressed the need to invest in Gold for now through ETFs in my stock accounts, else one can see some of the commodity funds popping up in the Combined Top 50.
I hope to make more investment to Gold in the coming weeks as any correction will be short term, and in long term, Gold is likely to double or treble in its price. Silver will eventually catch up with Gold from Gold Silver price ratio of currently 100 going down to average 16 historically, but I will wait to confirm the silver price perk up, when which happens, I will more funds into Silver than the Gold, but I will wait for now.
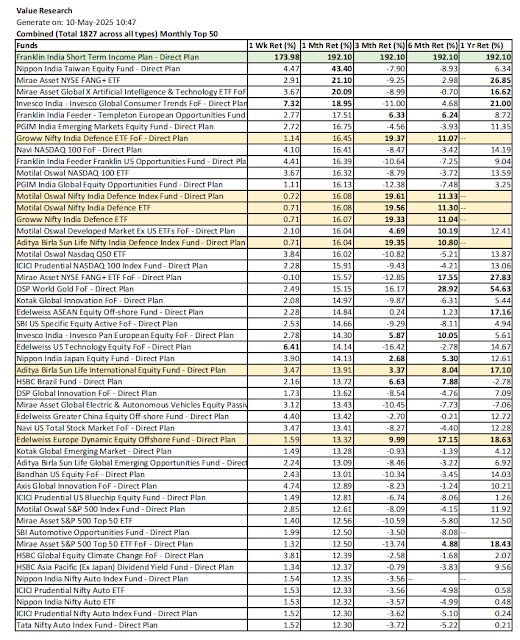
1.2. Combined Top 50
Green and Amber color marked mutual funds in the list: Since the focus is not only looking for the performance leaders, but also consistent above average performance across all the timelines, the funds are marked in Green or Amber to easily recognize consistency of perfromance among the leaders.
Green:
If the returns for all the available timelines from 1W thru 1Y is above the average within the list. The fund can not be marked green even with this rule if the returns are not available beyond a month, in which case the fund is marked as amber only.
Amber:
If the returns for all the available timelines from 1W thru 1Y is above the average within the list except for one timeline. For this exception, if any of the weekly and monthly returns are above average, then both timelines are considered to have above average
1.2.1. Combined Weekly Top 50

1.2.2. Combined Monthly Top 50

2. Equity Funds

Bottom line: Nippon India Japan Equity Fund and DSP World Gold FoF look promising to invest now.


Both the weekly and monthly bottom 50 lists are leveraged to identify potential bearish reversal indications of the funds. This is done by marking above average annual return in bold and below average returns for the week and month. The funds with both weekly and monthy below average, but annual above average are marked in darker red, while the funds with only one of the weekly and monthly below averages but with above average annual return are marked in light red.
Annual bottom 50 funds list is used to recognize potential bullish reversal. Any fund with above average return for both the week and the month in the list is marked as grey indicating potential bullish reversal.


Blog: NatsFunCorner! on Blogger
https://natsfuncorner.blogspot.com/
Other relevant Social Network Platform links:
Whatsapp Group: This whatsapp group is a peer group, people active in investment and trading (including day trading) are here, exchanging their insight and views. Please note that there is no room for promotional participation here.
https://chat.whatsapp.com/IuzkVAHgn1jJ20ZmB8m9Vz
FB: https://www.facebook.com/nupadhya/
YouTube: https://www.youtube.com/user/nupadhya
Instagram: https://www.instagram.com/natsupadhya/
Twitter (X): https://twitter.com/nupadhya
LinkedIn: https: https://www.linkedin.com/in/nupadhya/
Disclaimer:
- This is not a solicitation for mutual fund investment nor an advice. It is only an insight to help investment decisions based on the free MF performance data downloaded from Value Research. Investment decisions are only yours to make.
- Mutual fund investments are subjected to market risk. Read the propsectus of a mutual fund for all the risk information associated prior to investment.
- The author can not be responsible for the ommissions or errors in the data from Value Research or the data processing errors if any by the author.
- All your investment decisions need to be based on your decision finally, with no blame to anyone else later.
No comments:
Post a Comment